| Red | Green | Blue | |
| z | 17.64 | ||
| znorm | Inf | ||
| sky | -NaN | -NaN | -Inf |
| S/N | 24.5 | 42.7 | 47.0 |
| S/N(c) | 0.0 | 0.0 | 0.0 |
| SN(E/C) |

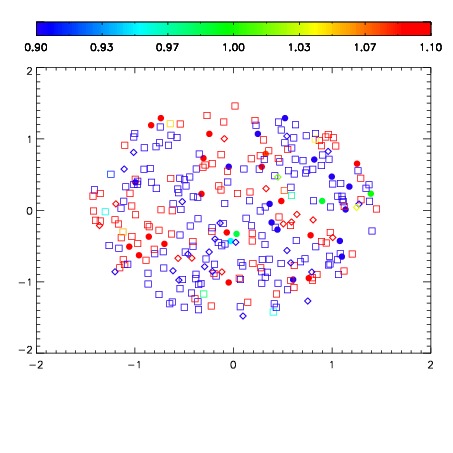
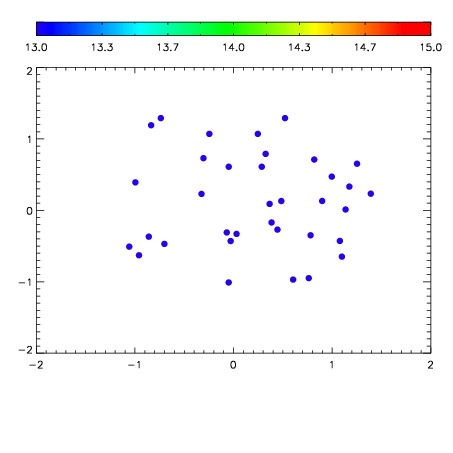

| Frame | Nreads | Zeropoints | Mag plots | Spatial mag deviation | Spatial sky 16325A emission deviations (filled: sky, open: star) | Spatial sky continuum emission | Spatial sky telluric CO2 absorption deviations (filled: H < 10) | |||||||||||||||||||||||
| 0 | 0 |
|
|
|
|
|
|
| IPAIR | NAME | SHIFT | NEWSHIFT | S/N | NAME | SHIFT | NEWSHIFT | S/N |
| 0 | 07500059 | 0.490429 | 0.00000 | 18.9745 | 07500057 | 3.73838e-05 | 0.490392 | 18.9478 |
| 1 | 07500058 | 0.488434 | 0.00199503 | 19.0108 | 07500060 | 0.0113529 | 0.479076 | 18.9767 |
| 2 | 07500054 | 0.485553 | 0.00487602 | 18.9183 | 07500056 | 0.00237849 | 0.488051 | 18.9429 |
| 3 | 07500055 | 0.486471 | 0.00395802 | 18.8827 | 07500053 | 0.00000 | 0.490429 | 18.8853 |