| Red | Green | Blue | |
| z | 17.64 | ||
| znorm | Inf | ||
| sky | -Inf | -Inf | -Inf |
| S/N | 21.3 | 35.5 | 38.5 |
| S/N(c) | 0.0 | 0.0 | 0.0 |
| SN(E/C) |
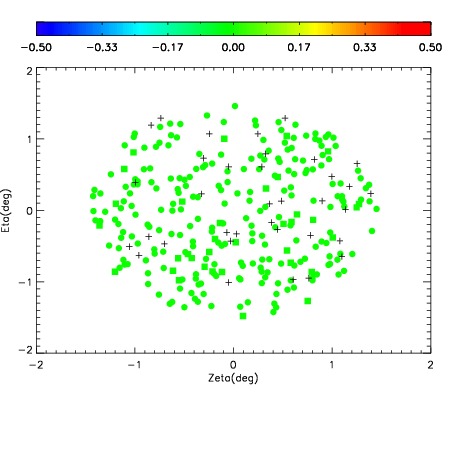
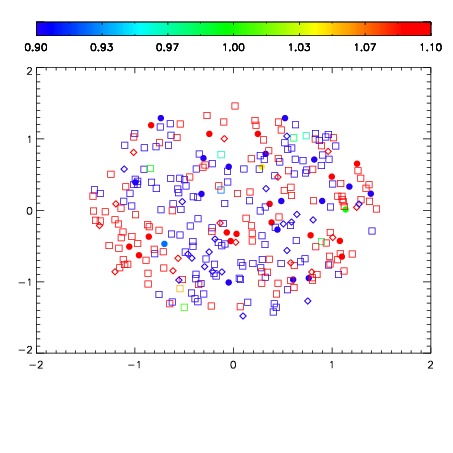
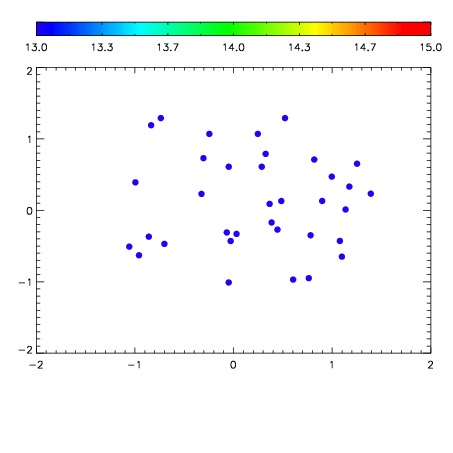

| Frame | Nreads | Zeropoints | Mag plots | Spatial mag deviation | Spatial sky 16325A emission deviations (filled: sky, open: star) | Spatial sky continuum emission | Spatial sky telluric CO2 absorption deviations (filled: H < 10) | |||||||||||||||||||||||
| 0 | 0 |
|
|
|
|
|
|
| IPAIR | NAME | SHIFT | NEWSHIFT | S/N | NAME | SHIFT | NEWSHIFT | S/N |
| 0 | 07850017 | 0.472586 | 0.00000 | 18.7881 | 07850015 | 6.75656e-05 | 0.472518 | 18.8223 |
| 1 | 07850016 | 0.471990 | 0.000596017 | 18.8985 | 07850018 | 0.000721203 | 0.471865 | 18.8447 |
| 2 | 07850012 | 0.472026 | 0.000560015 | 18.5129 | 07850014 | 0.00160298 | 0.470983 | 18.5403 |
| 3 | 07850013 | 0.471669 | 0.000917017 | 18.4802 | 07850011 | 0.00000 | 0.472586 | 18.4080 |