| Red | Green | Blue | |
| z | 17.64 | ||
| znorm | Inf | ||
| sky | -NaN | -Inf | -Inf |
| S/N | 23.9 | 42.5 | 44.4 |
| S/N(c) | 0.0 | 0.0 | 0.0 |
| SN(E/C) |
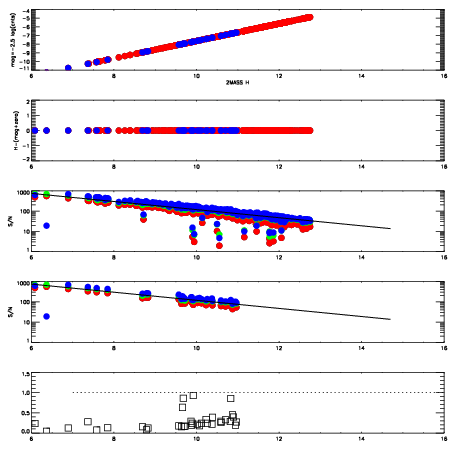
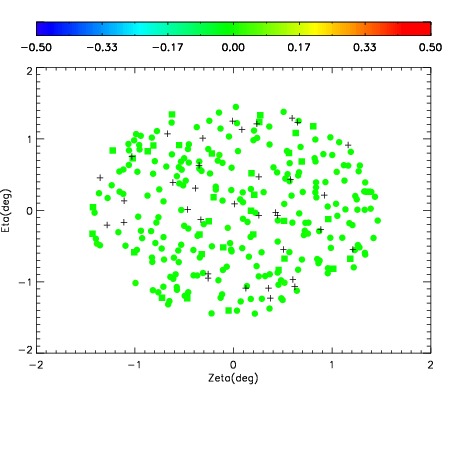
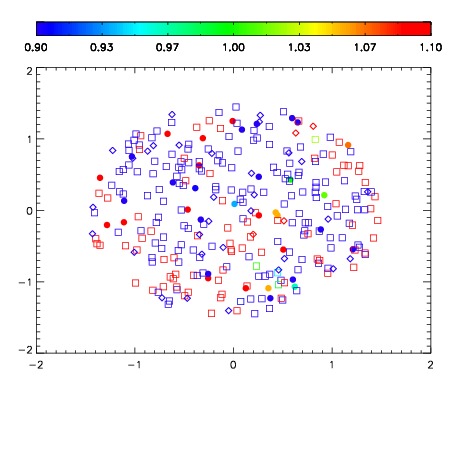
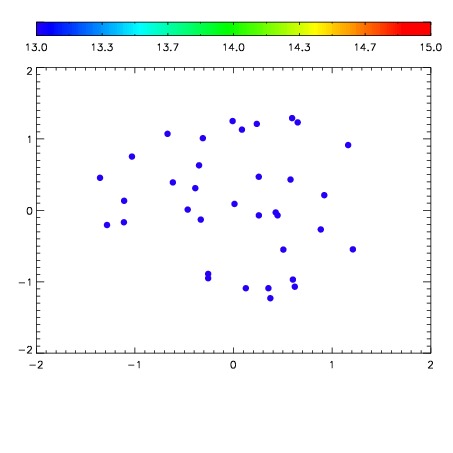

| Frame | Nreads | Zeropoints | Mag plots | Spatial mag deviation | Spatial sky 16325A emission deviations (filled: sky, open: star) | Spatial sky continuum emission | Spatial sky telluric CO2 absorption deviations (filled: H < 10) | |||||||||||||||||||||||
| 0 | 0 |
|
|
|
|
|
|
| IPAIR | NAME | SHIFT | NEWSHIFT | S/N | NAME | SHIFT | NEWSHIFT | S/N |
| 0 | 11360091 | 0.477776 | 0.00000 | 18.9924 | 11360085 | 0.00000 | 0.477776 | 18.9650 |
| 1 | 11360087 | 0.476946 | 0.000829995 | 19.0201 | 11360089 | -0.000856756 | 0.478633 | 19.0194 |
| 2 | 11360090 | 0.477011 | 0.000764996 | 18.9968 | 11360088 | -0.00169171 | 0.479468 | 18.9687 |
| 3 | 11360086 | 0.476608 | 0.00116798 | 18.9862 | 11360092 | -0.00135074 | 0.479127 | 18.9628 |