| Red | Green | Blue | |
| z | 17.64 | ||
| znorm | Inf | ||
| sky | -Inf | -Inf | -NaN |
| S/N | 26.3 | 45.4 | 47.1 |
| S/N(c) | 0.0 | 0.0 | 0.0 |
| SN(E/C) |
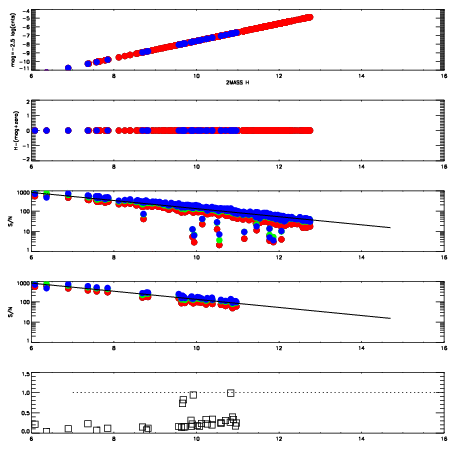
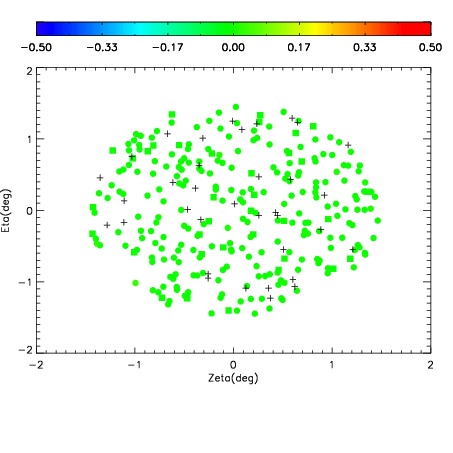
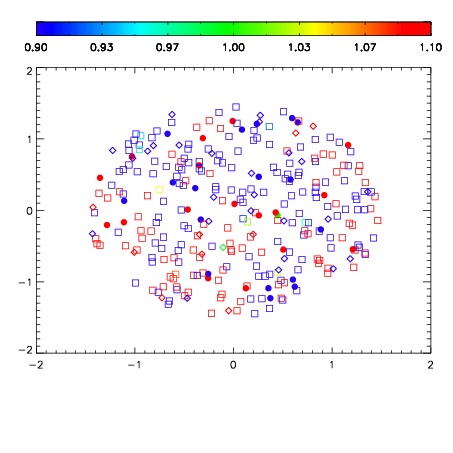
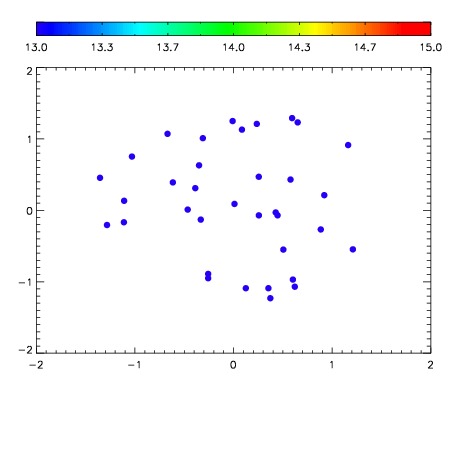

| Frame | Nreads | Zeropoints | Mag plots | Spatial mag deviation | Spatial sky 16325A emission deviations (filled: sky, open: star) | Spatial sky continuum emission | Spatial sky telluric CO2 absorption deviations (filled: H < 10) | |||||||||||||||||||||||
| 0 | 0 |
|
|
|
|
|
|
| IPAIR | NAME | SHIFT | NEWSHIFT | S/N | NAME | SHIFT | NEWSHIFT | S/N |
| 0 | 11370033 | 0.473483 | 0.00000 | 18.9246 | 11370038 | -0.00236361 | 0.475847 | 18.9919 |
| 1 | 11370032 | 0.472154 | 0.00132900 | 19.0011 | 11370035 | -0.00296946 | 0.476452 | 19.0536 |
| 2 | 11370036 | 0.472954 | 0.000528991 | 18.9665 | 11370039 | -0.00187281 | 0.475356 | 19.0419 |
| 3 | 11370040 | 0.473342 | 0.000140995 | 18.7707 | 11370031 | 0.00000 | 0.473483 | 18.9915 |
| 4 | 11370037 | 0.473346 | 0.000137001 | 18.7446 | 11370034 | -0.00358456 | 0.477068 | 18.9775 |