| Red | Green | Blue | |
| z | 17.64 | ||
| znorm | Inf | ||
| sky | -NaN | -NaN | -Inf |
| S/N | 25.0 | 43.1 | 47.4 |
| S/N(c) | 0.0 | 0.0 | 0.0 |
| SN(E/C) |
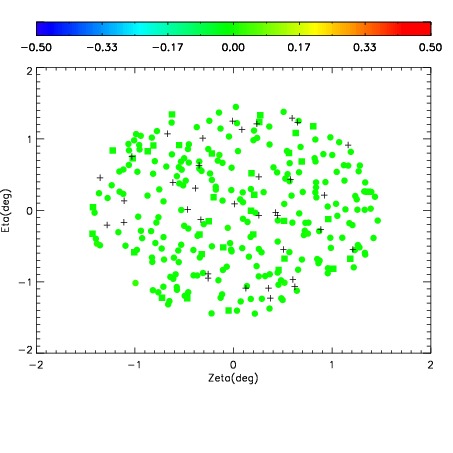
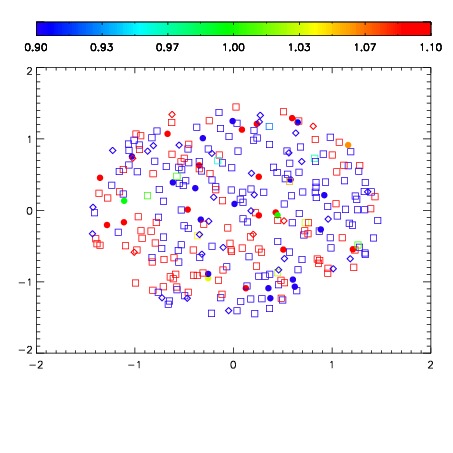


| Frame | Nreads | Zeropoints | Mag plots | Spatial mag deviation | Spatial sky 16325A emission deviations (filled: sky, open: star) | Spatial sky continuum emission | Spatial sky telluric CO2 absorption deviations (filled: H < 10) | |||||||||||||||||||||||
| 0 | 0 |
|
|
|
|
|
|
| IPAIR | NAME | SHIFT | NEWSHIFT | S/N | NAME | SHIFT | NEWSHIFT | S/N |
| 0 | 11410084 | 0.476393 | 0.00000 | 19.0135 | 11410081 | -0.00274246 | 0.479135 | 19.0097 |
| 1 | 11410079 | 0.475514 | 0.000879019 | 19.0024 | 11410082 | -0.00263712 | 0.479030 | 18.9736 |
| 2 | 11410083 | 0.475367 | 0.00102600 | 19.0006 | 11410085 | -0.00417644 | 0.480569 | 18.9608 |
| 3 | 11410080 | 0.476361 | 3.20077e-05 | 18.9956 | 11410078 | 0.00000 | 0.476393 | 18.9427 |