| Red | Green | Blue | |
| z | 17.64 | ||
| znorm | Inf | ||
| sky | -Inf | -Inf | -Inf |
| S/N | 26.3 | 44.5 | 47.5 |
| S/N(c) | 0.0 | 0.0 | 0.0 |
| SN(E/C) |
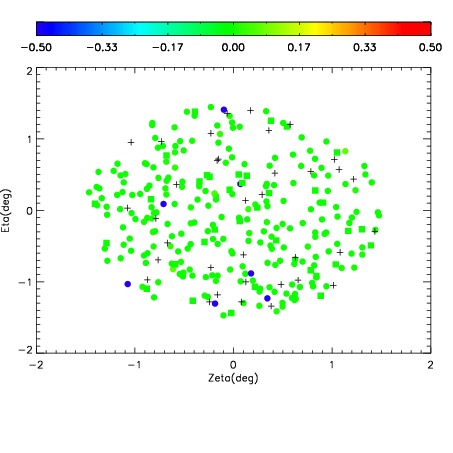
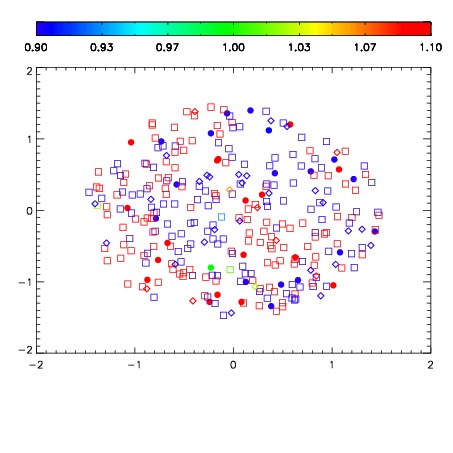
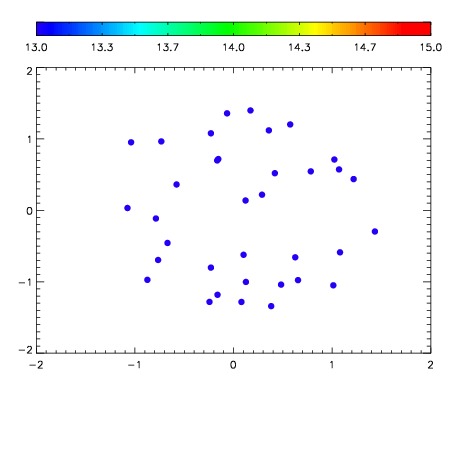

| Frame | Nreads | Zeropoints | Mag plots | Spatial mag deviation | Spatial sky 16325A emission deviations (filled: sky, open: star) | Spatial sky continuum emission | Spatial sky telluric CO2 absorption deviations (filled: H < 10) | |||||||||||||||||||||||
| 0 | 0 |
|
|
|
|
|
|
| IPAIR | NAME | SHIFT | NEWSHIFT | S/N | NAME | SHIFT | NEWSHIFT | S/N |
| 0 | 08480039 | 0.489178 | 0.00000 | 18.9390 | 08480037 | 0.00000 | 0.489178 | 18.9487 |
| 1 | 08480043 | 0.487779 | 0.00139901 | 18.9983 | 08480044 | 0.00270508 | 0.486473 | 18.9917 |
| 2 | 08480042 | 0.486160 | 0.00301799 | 18.9980 | 08480041 | 0.000644241 | 0.488534 | 18.9753 |
| 3 | 08480038 | 0.488109 | 0.00106901 | 18.9456 | 08480040 | 0.00217565 | 0.487002 | 18.9564 |