| Red | Green | Blue | |
| z | 17.64 | ||
| znorm | Inf | ||
| sky | -Inf | -Inf | -Inf |
| S/N | 16.2 | 30.2 | 31.2 |
| S/N(c) | 0.0 | 0.0 | 0.0 |
| SN(E/C) |

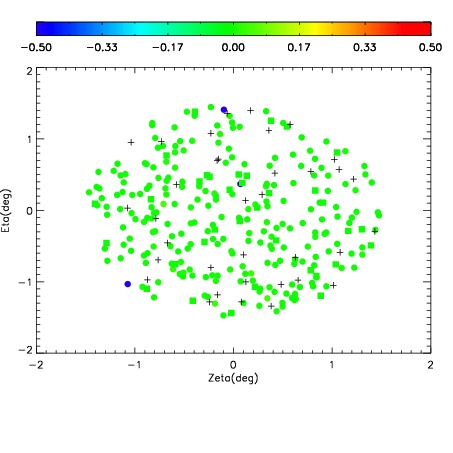
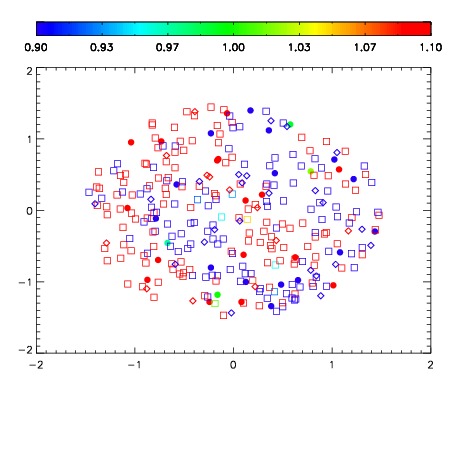


| Frame | Nreads | Zeropoints | Mag plots | Spatial mag deviation | Spatial sky 16325A emission deviations (filled: sky, open: star) | Spatial sky continuum emission | Spatial sky telluric CO2 absorption deviations (filled: H < 10) | |||||||||||||||||||||||
| 0 | 0 |
|
|
|
|
|
|
| IPAIR | NAME | SHIFT | NEWSHIFT | S/N | NAME | SHIFT | NEWSHIFT | S/N |
| 0 | 08700024 | 0.479289 | 0.00000 | 18.0920 | 08700026 | 0.00254802 | 0.476741 | 18.3738 |
| 1 | 08700023 | 0.477969 | 0.00132000 | 18.5464 | 08700022 | 0.00000 | 0.479289 | 18.5752 |
| 2 | 08700028 | 0.478902 | 0.000386983 | 18.0978 | 08700029 | 0.00128861 | 0.478000 | 18.3902 |
| 3 | 08700027 | 0.478679 | 0.000609994 | 18.0710 | 08700025 | 0.00225567 | 0.477033 | 18.0950 |