| Red | Green | Blue | |
| z | 17.64 | ||
| znorm | Inf | ||
| sky | -Inf | -Inf | -NaN |
| S/N | 26.5 | 45.4 | 48.9 |
| S/N(c) | 0.0 | 0.0 | 0.0 |
| SN(E/C) |
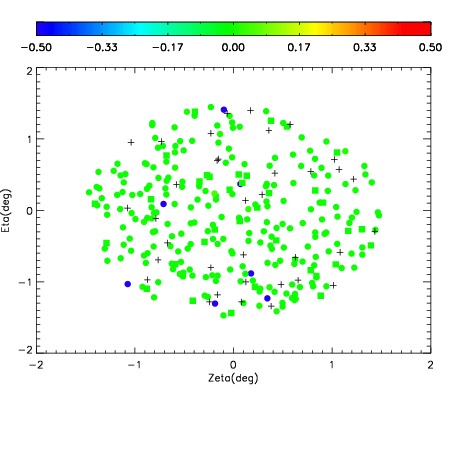
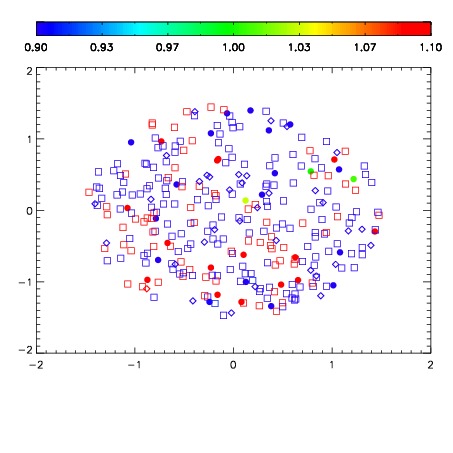


| Frame | Nreads | Zeropoints | Mag plots | Spatial mag deviation | Spatial sky 16325A emission deviations (filled: sky, open: star) | Spatial sky continuum emission | Spatial sky telluric CO2 absorption deviations (filled: H < 10) | |||||||||||||||||||||||
| 0 | 0 |
|
|
|
|
|
|
| IPAIR | NAME | SHIFT | NEWSHIFT | S/N | NAME | SHIFT | NEWSHIFT | S/N |
| 0 | 08760031 | 0.483007 | 0.00000 | 18.9785 | 08760033 | 0.00420680 | 0.478800 | 18.9505 |
| 1 | 08760032 | 0.482919 | 8.80063e-05 | 19.0179 | 08760029 | 0.00270808 | 0.480299 | 19.0109 |
| 2 | 08760028 | 0.482026 | 0.000981003 | 19.0133 | 08760030 | 0.00323814 | 0.479769 | 18.9811 |
| 3 | 08760027 | 0.481563 | 0.00144401 | 19.0074 | 08760026 | 0.00000 | 0.483007 | 18.9766 |