| Red | Green | Blue | |
| z | 17.64 | ||
| znorm | Inf | ||
| sky | -Inf | -Inf | -Inf |
| S/N | 22.8 | 39.2 | 42.6 |
| S/N(c) | 0.0 | 0.0 | 0.0 |
| SN(E/C) |
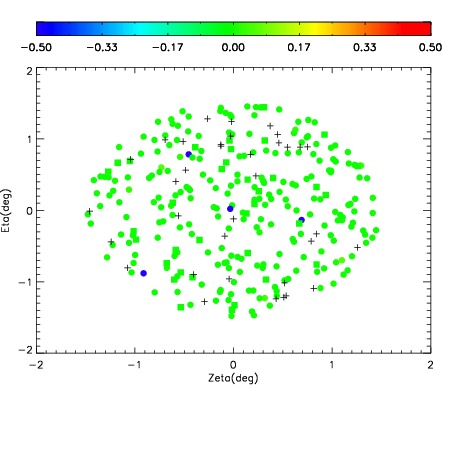
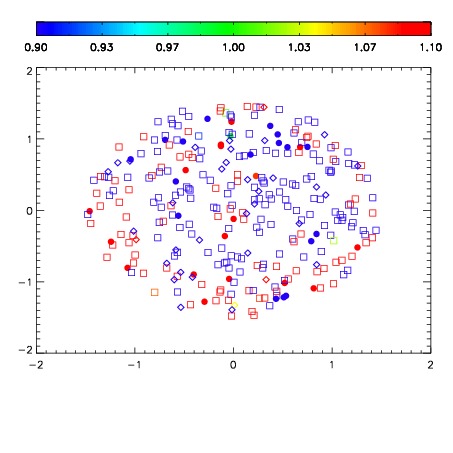


| Frame | Nreads | Zeropoints | Mag plots | Spatial mag deviation | Spatial sky 16325A emission deviations (filled: sky, open: star) | Spatial sky continuum emission | Spatial sky telluric CO2 absorption deviations (filled: H < 10) | |||||||||||||||||||||||
| 0 | 0 |
|
|
|
|
|
|
| IPAIR | NAME | SHIFT | NEWSHIFT | S/N | NAME | SHIFT | NEWSHIFT | S/N |
| 0 | 08450050 | 0.493960 | 0.00000 | 19.0029 | 08450047 | 7.07647e-05 | 0.493889 | 18.9313 |
| 1 | 08450049 | 0.493211 | 0.000748992 | 19.0032 | 08450048 | -0.00136538 | 0.495325 | 18.9785 |
| 2 | 08450046 | 0.488405 | 0.00555500 | 18.9224 | 08450051 | 0.00171516 | 0.492245 | 18.9076 |
| 3 | 08450045 | 0.488988 | 0.00497198 | 18.6440 | 08450044 | 0.00000 | 0.493960 | 18.7882 |