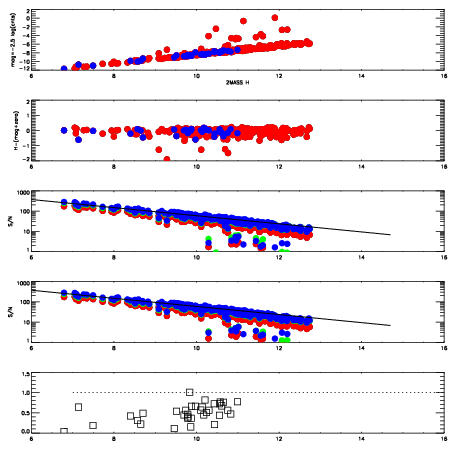
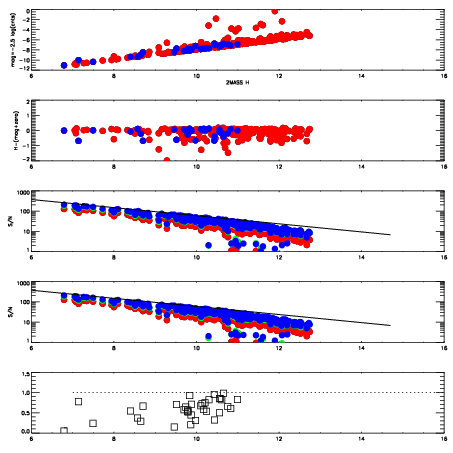
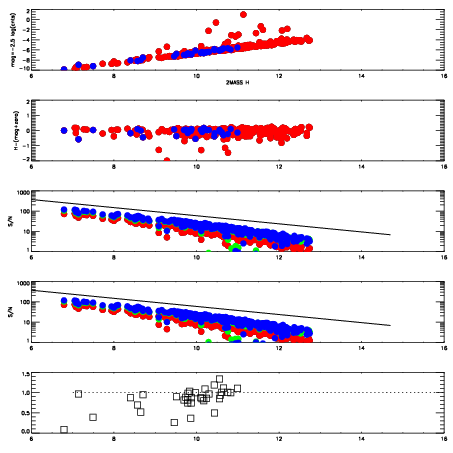
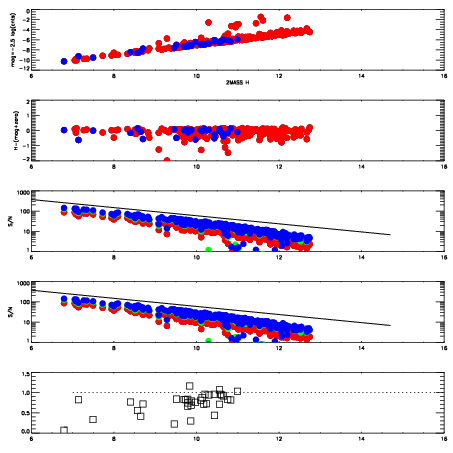
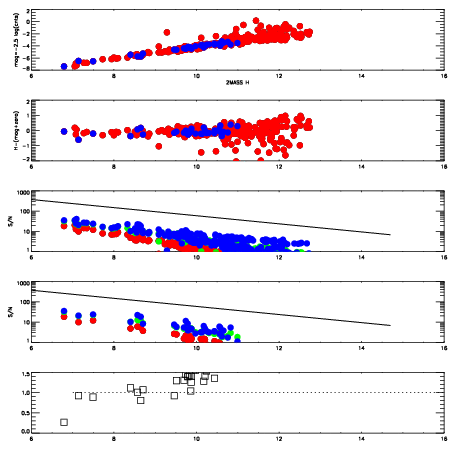
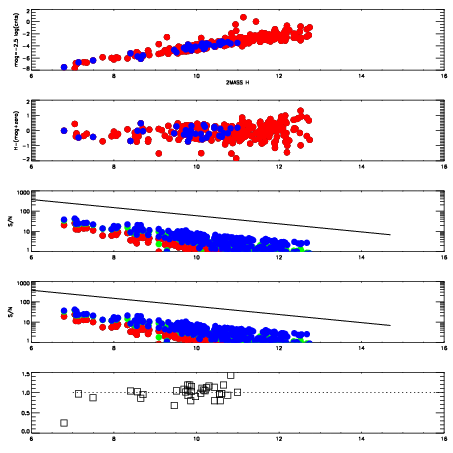
| Frame | Nreads | Zeropoints | Mag plots
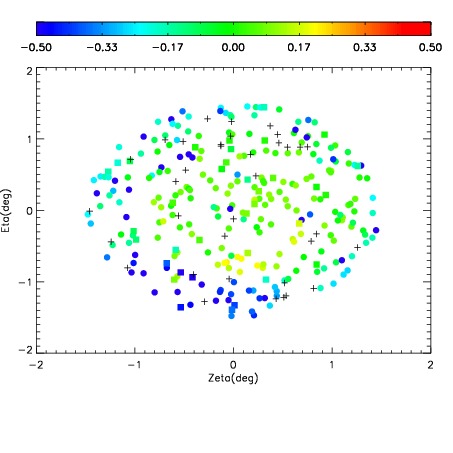
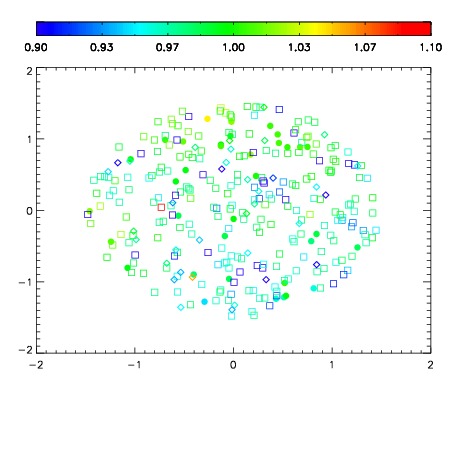
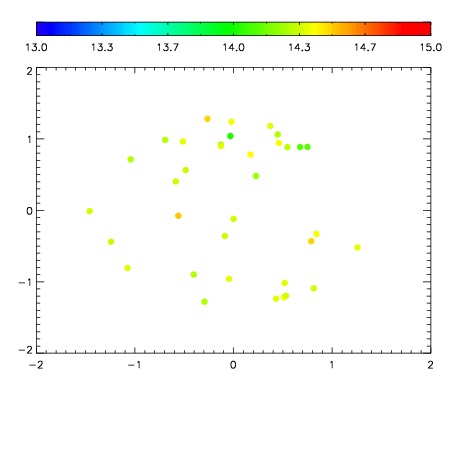
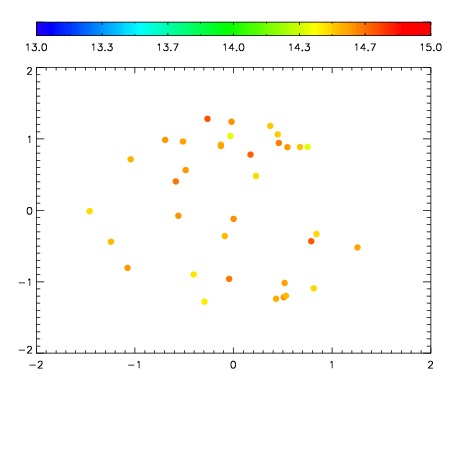
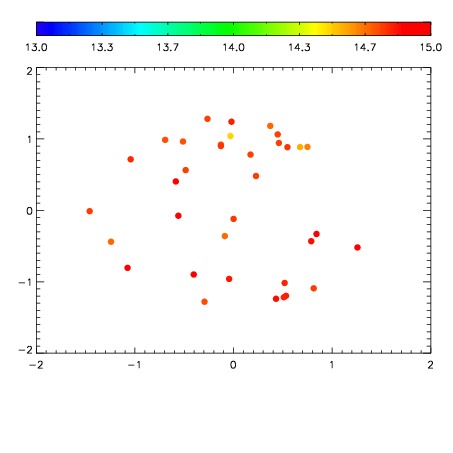
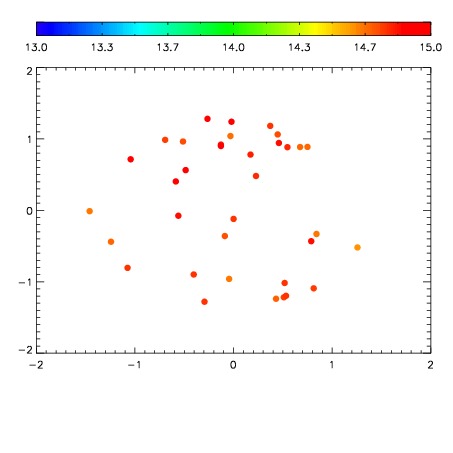
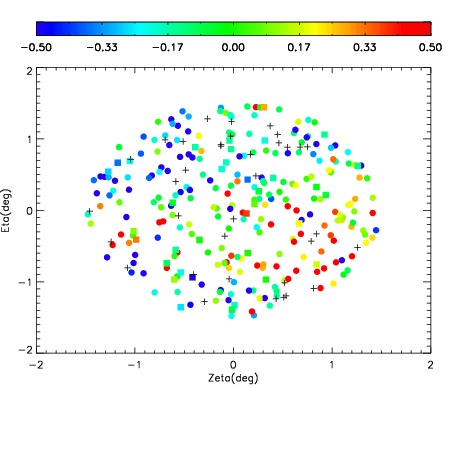
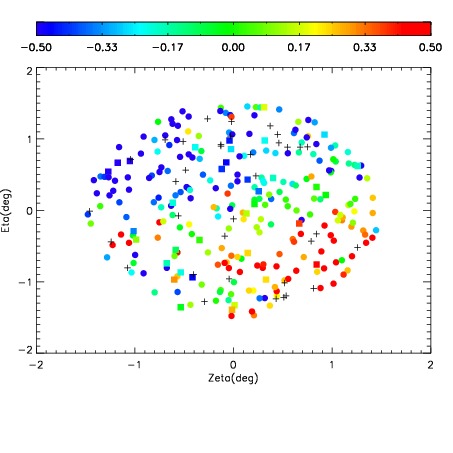
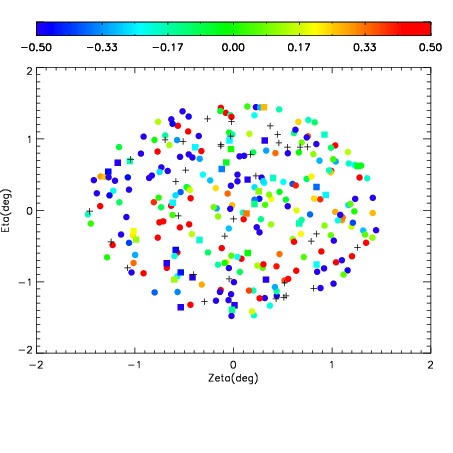
| Spatial mag deviation
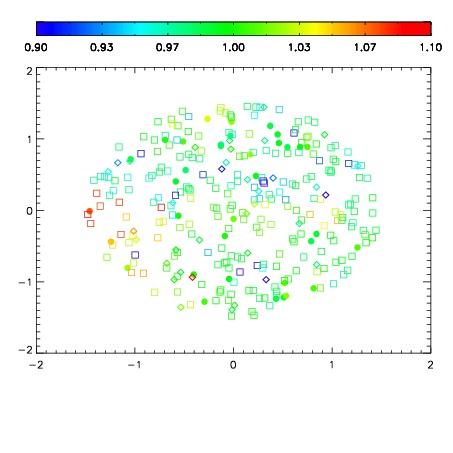
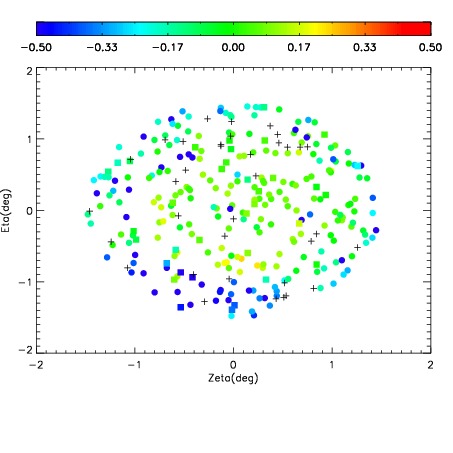
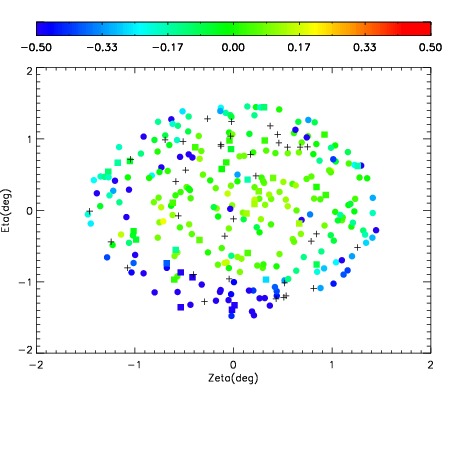
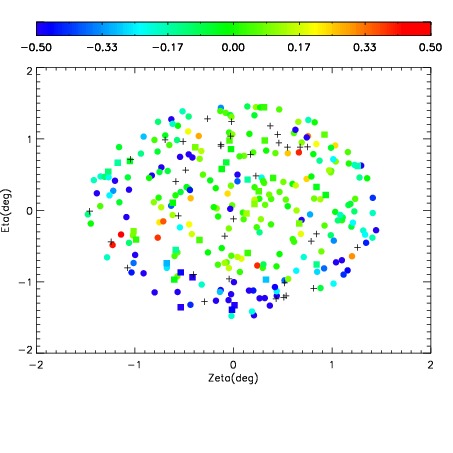
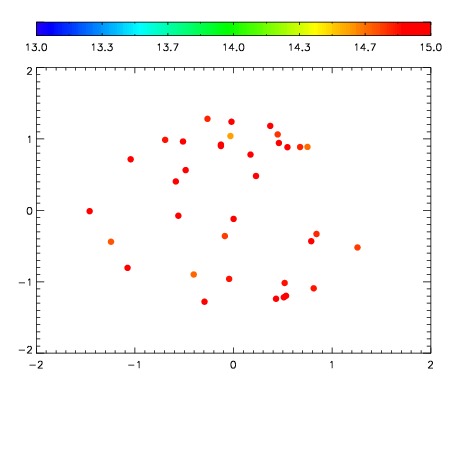
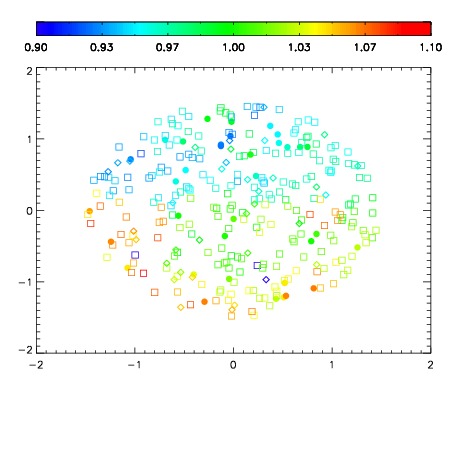
| Spatial sky 16325A emission deviations (filled: sky, open: star)
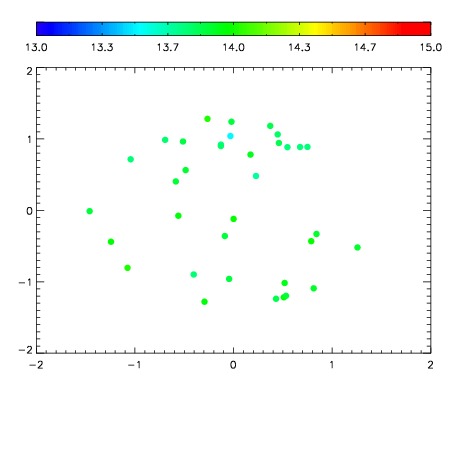
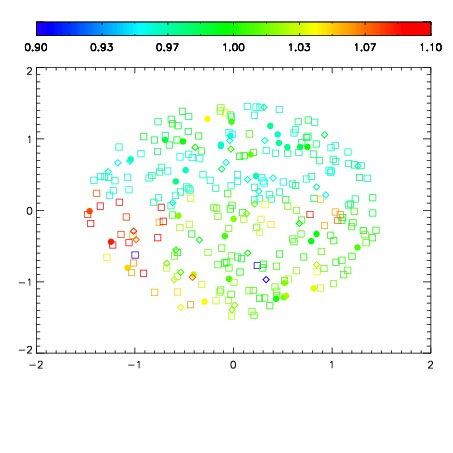
| Spatial sky continuum emission
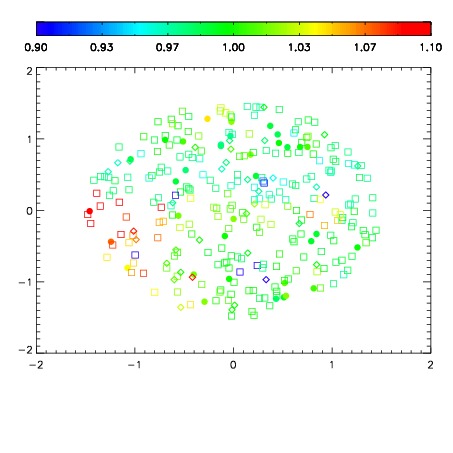
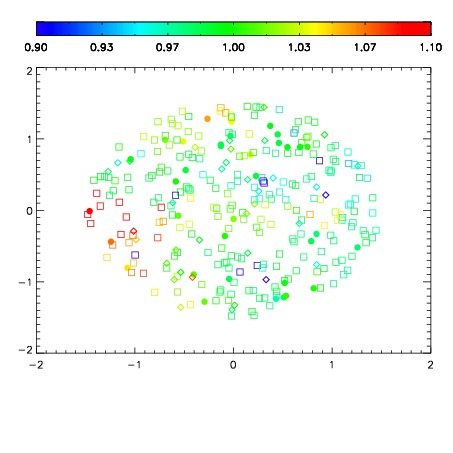
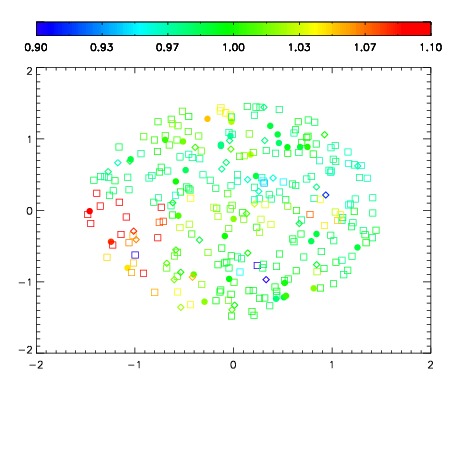
| Spatial sky telluric CO2 absorption deviations (filled: H < 10)
|
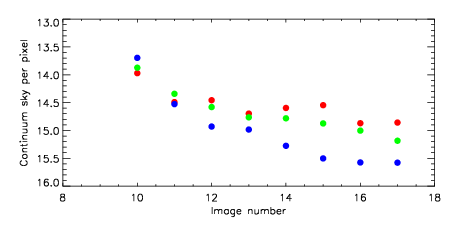
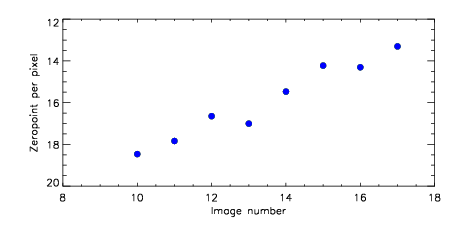
| 8780010
| 47
| | Red | Green | Blue
| | z | | 18.47
| | znorm | | 14.29
| | sky | 14.0 | 13.9 | 13.7
| | S/N | 8.8 | 15.0 | 15.5
| | S/N(c) | 12.2 | 17.9 | 22.7
| | SN(E/C) 0.51
|
| 
| 
| 
| 
| 
|
| 8780011
| 47
| | Red | Green | Blue
| | z | | 17.84
| | znorm | | 13.66
| | sky | 14.5 | 14.3 | 14.5
| | S/N | 4.5 | 9.5 | 9.8
| | S/N(c) | 7.8 | 12.8 | 16.1
| | SN(E/C) 0.61
|
| 
| 
| 
| 
| 
|
| 8780012
| 47
| | Red | Green | Blue
| | z | | 16.65
| | znorm | | 12.47
| | sky | 14.5 | 14.6 | 14.9
| | S/N | 1.9 | 4.5 | 5.3
| | S/N(c) | 3.2 | 6.3 | 7.7
| | SN(E/C) 0.87
|
| 
| 
| 
| 
| 
|
| 8780013
| 47
| | Red | Green | Blue
| | z | | 17.01
| | znorm | | 12.83
| | sky | 14.7 | 14.8 | 15.0
| | S/N | 2.7 | 5.8 | 6.4
| | S/N(c) | 4.2 | 7.9 | 9.7
| | SN(E/C) 0.81
|
| 
| 
| 
| 
| 
|
| 8780014
| 47
| | Red | Green | Blue
| | z | | 15.47
| | znorm | | 11.29
| | sky | 14.6 | 14.8 | 15.3
| | S/N | 0.8 | 1.9 | 2.0
| | S/N(c) | 1.2 | 2.6 | 3.5
| | SN(E/C) 1.01
|
| 
| 
| 
| 
| 
|
| 8780015
| 47
| | Red | Green | Blue
| | z | | 14.23
| | znorm | | 10.05
| | sky | 14.5 | 14.9 | 15.5
| | S/N | 0.4 | 0.7 | 1.4
| | S/N(c) | 0.0 | 0.0 | 0.0
| | SN(E/C) 1.40
|
| 
| 
| 
| 
| 
|
| 8780016
| 47
| | Red | Green | Blue
| | z | | 14.31
| | znorm | | 10.13
| | sky | 14.9 | 15.0 | 15.6
| | S/N | 0.4 | 0.8 | 1.8
| | S/N(c) | 0.4 | 0.9 | 1.8
| | SN(E/C) 1.01
|
| 
| 
| 
| 
| 
|
| 8780017
| 47
| | Red | Green | Blue
| | z | | 13.30
| | znorm | | 9.12
| | sky | 14.9 | 15.2 | 15.6
| | S/N | -0.0 | 0.4 | 0.6
| | S/N(c) | 0.0 | 0.0 | 0.0
| | SN(E/C) 2.05
|
| 
| 
| 
| 
| 
|