| Red | Green | Blue | |
| z | 17.64 | ||
| znorm | Inf | ||
| sky | -Inf | -Inf | -Inf |
| S/N | 6.2 | 11.7 | 12.4 |
| S/N(c) | 0.0 | 0.0 | 0.0 |
| SN(E/C) |
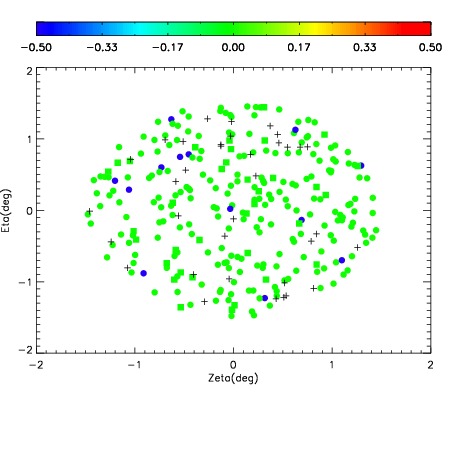
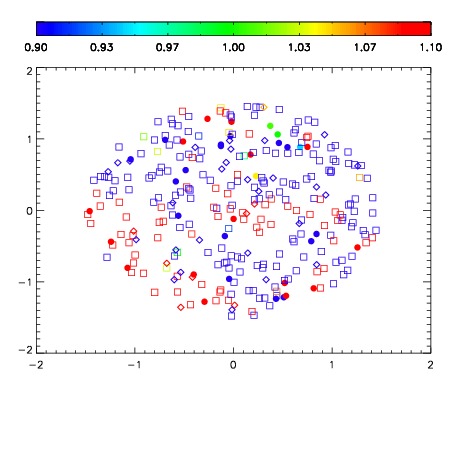
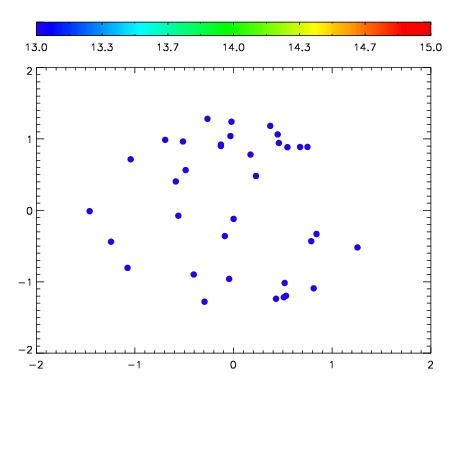

| Frame | Nreads | Zeropoints | Mag plots | Spatial mag deviation | Spatial sky 16325A emission deviations (filled: sky, open: star) | Spatial sky continuum emission | Spatial sky telluric CO2 absorption deviations (filled: H < 10) | |||||||||||||||||||||||
| 0 | 0 |
|
|
|
|
|
|
| IPAIR | NAME | SHIFT | NEWSHIFT | S/N | NAME | SHIFT | NEWSHIFT | S/N |
| 0 | 08780012 | 0.479381 | 0.00000 | 16.6140 | 08780013 | 0.00127442 | 0.478107 | 16.9730 |
| 1 | 08780011 | 0.479116 | 0.000265002 | 17.8141 | 08780010 | 0.00000 | 0.479381 | 18.4311 |
| 2 | 08780016 | 0.475668 | 0.00371298 | 14.1853 | 08780014 | 0.00147738 | 0.477904 | 15.4560 |