| Red | Green | Blue | |
| z | 17.64 | ||
| znorm | Inf | ||
| sky | -NaN | -NaN | -Inf |
| S/N | 27.3 | 48.0 | 48.0 |
| S/N(c) | 0.0 | 0.0 | 0.0 |
| SN(E/C) |
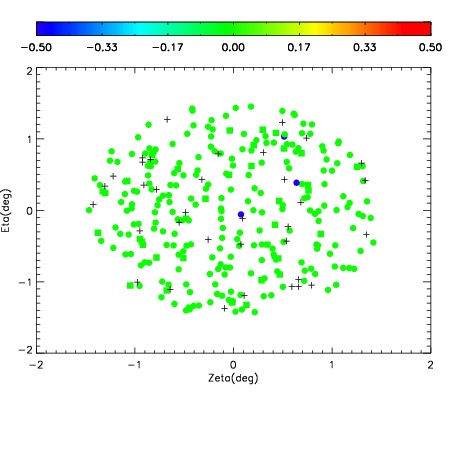
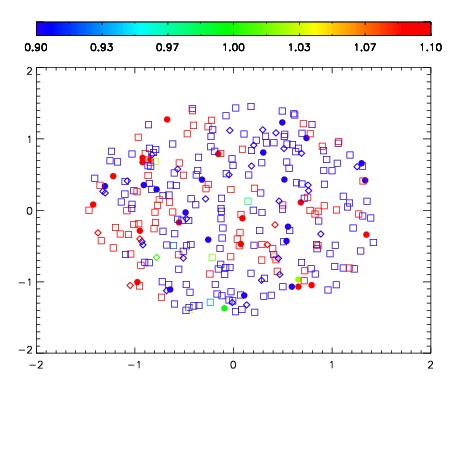


| Frame | Nreads | Zeropoints | Mag plots | Spatial mag deviation | Spatial sky 16325A emission deviations (filled: sky, open: star) | Spatial sky continuum emission | Spatial sky telluric CO2 absorption deviations (filled: H < 10) | |||||||||||||||||||||||
| 0 | 0 |
|
|
|
|
|
|
| IPAIR | NAME | SHIFT | NEWSHIFT | S/N | NAME | SHIFT | NEWSHIFT | S/N |
| 0 | 08420032 | 0.493189 | 0.00000 | 19.0592 | 08420030 | 0.00226517 | 0.490924 | 19.0532 |
| 1 | 08420028 | 0.492311 | 0.000878006 | 19.0695 | 08420033 | 0.00393902 | 0.489250 | 19.0785 |
| 2 | 08420031 | 0.493106 | 8.29995e-05 | 19.0384 | 08420029 | 0.00357248 | 0.489617 | 19.0385 |
| 3 | 08420027 | 0.492953 | 0.000236005 | 19.0271 | 08420026 | 0.00000 | 0.493189 | 18.9066 |