| Red | Green | Blue | |
| z | 17.64 | ||
| znorm | Inf | ||
| sky | -Inf | -Inf | -Inf |
| S/N | 27.5 | 47.6 | 48.9 |
| S/N(c) | 0.0 | 0.0 | 0.0 |
| SN(E/C) |
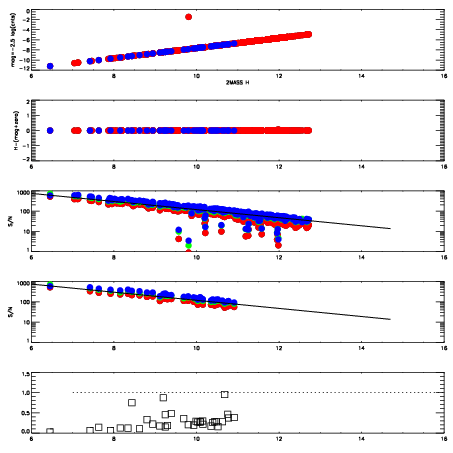
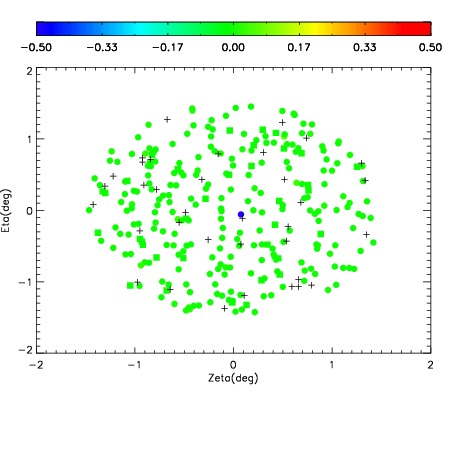
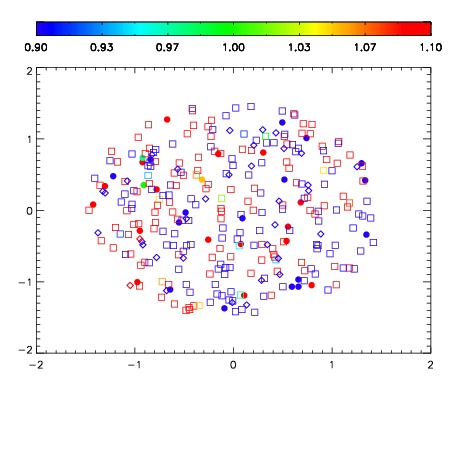


| Frame | Nreads | Zeropoints | Mag plots | Spatial mag deviation | Spatial sky 16325A emission deviations (filled: sky, open: star) | Spatial sky continuum emission | Spatial sky telluric CO2 absorption deviations (filled: H < 10) | |||||||||||||||||||||||
| 0 | 0 |
|
|
|
|
|
|
| IPAIR | NAME | SHIFT | NEWSHIFT | S/N | NAME | SHIFT | NEWSHIFT | S/N |
| 0 | 08700017 | 0.484213 | 0.00000 | 19.0414 | 08700015 | 0.00401662 | 0.480196 | 19.0600 |
| 1 | 08700016 | 0.483797 | 0.000415981 | 19.0400 | 08700018 | 0.00372362 | 0.480489 | 19.0220 |
| 2 | 08700013 | 0.482177 | 0.00203601 | 19.0222 | 08700014 | 0.00348494 | 0.480728 | 19.0024 |
| 3 | 08700012 | 0.480460 | 0.00375301 | 19.0062 | 08700011 | 0.00000 | 0.484213 | 18.9828 |