| Red | Green | Blue | |
| z | 17.64 | ||
| znorm | Inf | ||
| sky | -NaN | -NaN | -Inf |
| S/N | 20.9 | 36.5 | 38.8 |
| S/N(c) | 0.0 | 0.0 | 0.0 |
| SN(E/C) |


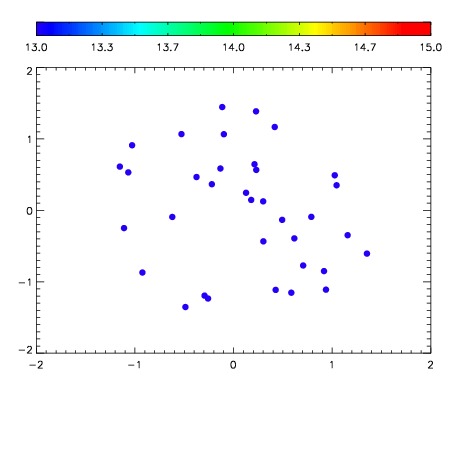

| Frame | Nreads | Zeropoints | Mag plots | Spatial mag deviation | Spatial sky 16325A emission deviations (filled: sky, open: star) | Spatial sky continuum emission | Spatial sky telluric CO2 absorption deviations (filled: H < 10) | |||||||||||||||||||||||
| 0 | 0 |
|
|
|
|
|
|
| IPAIR | NAME | SHIFT | NEWSHIFT | S/N | NAME | SHIFT | NEWSHIFT | S/N |
| 0 | 08400013 | 0.507757 | 0.00000 | 18.7715 | 08400011 | 0.00000 | 0.507757 | 18.8499 |
| 1 | 08400012 | 0.506834 | 0.000923038 | 18.9516 | 08400018 | 0.00132610 | 0.506431 | 18.8674 |
| 2 | 08400017 | 0.505073 | 0.00268400 | 18.6549 | 08400014 | 0.00223459 | 0.505522 | 18.7216 |
| 3 | 08400016 | 0.504961 | 0.00279599 | 18.5738 | 08400015 | 0.000522013 | 0.507235 | 18.6886 |