| Red | Green | Blue | |
| z | 17.64 | ||
| znorm | Inf | ||
| sky | -NaN | -Inf | -Inf |
| S/N | 24.6 | 43.0 | 45.3 |
| S/N(c) | 0.0 | 0.0 | 0.0 |
| SN(E/C) |
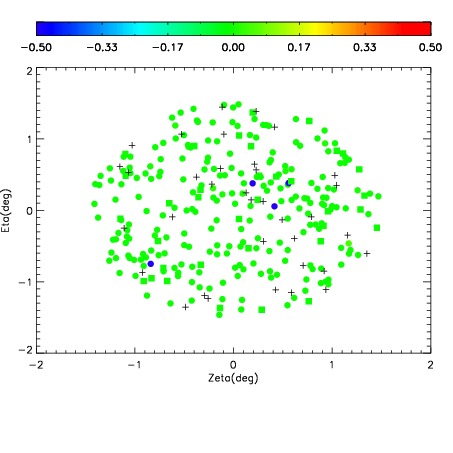
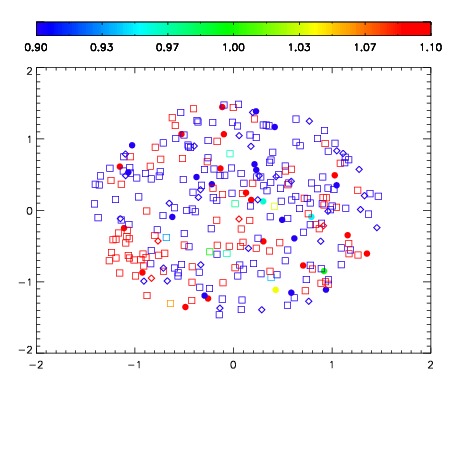


| Frame | Nreads | Zeropoints | Mag plots | Spatial mag deviation | Spatial sky 16325A emission deviations (filled: sky, open: star) | Spatial sky continuum emission | Spatial sky telluric CO2 absorption deviations (filled: H < 10) | |||||||||||||||||||||||
| 0 | 0 |
|
|
|
|
|
|
| IPAIR | NAME | SHIFT | NEWSHIFT | S/N | NAME | SHIFT | NEWSHIFT | S/N |
| 0 | 08450035 | 0.489668 | 0.00000 | 18.9809 | 08450036 | 0.00576047 | 0.483908 | 19.0343 |
| 1 | 08450034 | 0.488537 | 0.00113100 | 19.0287 | 08450033 | 0.00290129 | 0.486767 | 19.0602 |
| 2 | 08450031 | 0.488994 | 0.000674009 | 18.9348 | 08450032 | 0.00380912 | 0.485859 | 18.9969 |
| 3 | 08450030 | 0.488285 | 0.00138301 | 18.8730 | 08450029 | 0.00000 | 0.489668 | 18.9230 |