| Red | Green | Blue | |
| z | 17.64 | ||
| znorm | Inf | ||
| sky | -NaN | -Inf | -Inf |
| S/N | 26.5 | 44.9 | 46.7 |
| S/N(c) | 0.0 | 0.0 | 0.0 |
| SN(E/C) |
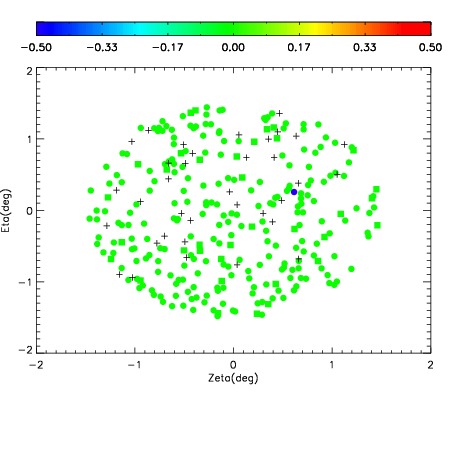
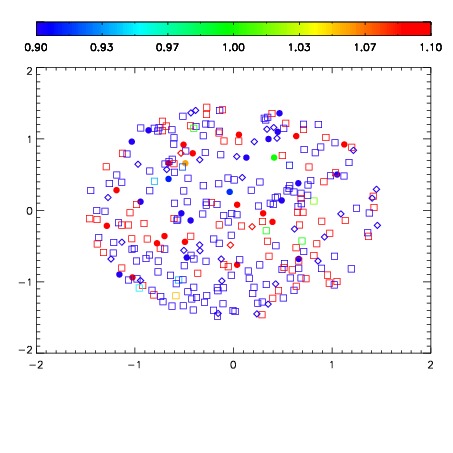


| Frame | Nreads | Zeropoints | Mag plots | Spatial mag deviation | Spatial sky 16325A emission deviations (filled: sky, open: star) | Spatial sky continuum emission | Spatial sky telluric CO2 absorption deviations (filled: H < 10) | |||||||||||||||||||||||
| 0 | 0 |
|
|
|
|
|
|
| IPAIR | NAME | SHIFT | NEWSHIFT | S/N | NAME | SHIFT | NEWSHIFT | S/N |
| 0 | 07920039 | 0.493682 | 0.00000 | 19.0496 | 07920037 | -0.00206342 | 0.495745 | 19.0618 |
| 1 | 07920038 | 0.493622 | 5.99921e-05 | 19.0652 | 07920036 | -0.000724099 | 0.494406 | 19.0738 |
| 2 | 07920035 | 0.493433 | 0.000248998 | 19.0254 | 07920040 | -0.00155466 | 0.495237 | 18.9907 |
| 3 | 07920034 | 0.492238 | 0.00144401 | 18.9606 | 07920033 | 0.00000 | 0.493682 | 18.9026 |