| Red | Green | Blue | |
| z | 17.64 | ||
| znorm | Inf | ||
| sky | -Inf | -Inf | -Inf |
| S/N | 25.1 | 43.9 | 46.9 |
| S/N(c) | 0.0 | 0.0 | 0.0 |
| SN(E/C) |
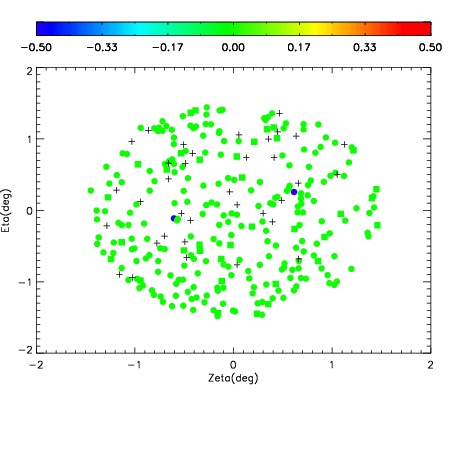
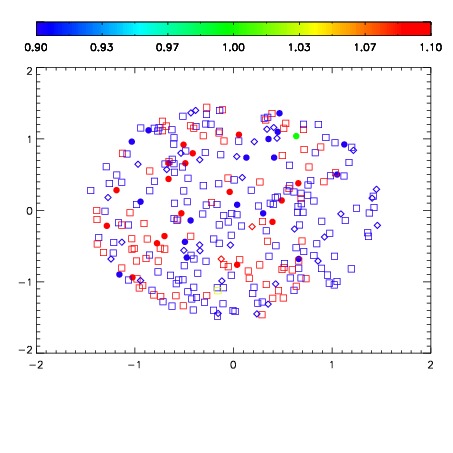
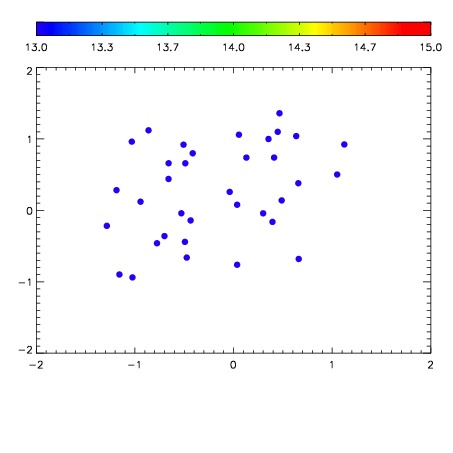

| Frame | Nreads | Zeropoints | Mag plots | Spatial mag deviation | Spatial sky 16325A emission deviations (filled: sky, open: star) | Spatial sky continuum emission | Spatial sky telluric CO2 absorption deviations (filled: H < 10) | |||||||||||||||||||||||
| 0 | 0 |
|
|
|
|
|
|
| IPAIR | NAME | SHIFT | NEWSHIFT | S/N | NAME | SHIFT | NEWSHIFT | S/N |
| 0 | 08150028 | 0.513960 | 0.00000 | 18.9928 | 08150030 | 0.000115845 | 0.513844 | 19.0483 |
| 1 | 08150027 | 0.502212 | 0.0117480 | 18.9973 | 08150033 | -0.00129431 | 0.515254 | 19.0524 |
| 2 | 08150031 | 0.501306 | 0.0126540 | 18.9789 | 08150026 | 0.00000 | 0.513960 | 18.9952 |
| 3 | 08150032 | 0.511969 | 0.00199103 | 18.9222 | 08150029 | -2.20723e-07 | 0.513960 | 18.9692 |