| Red | Green | Blue | |
| z | 17.64 | ||
| znorm | Inf | ||
| sky | -NaN | -Inf | -NaN |
| S/N | 24.9 | 43.0 | 45.0 |
| S/N(c) | 0.0 | 0.0 | 0.0 |
| SN(E/C) |
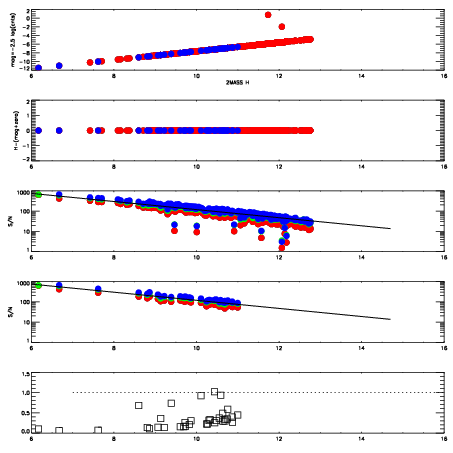
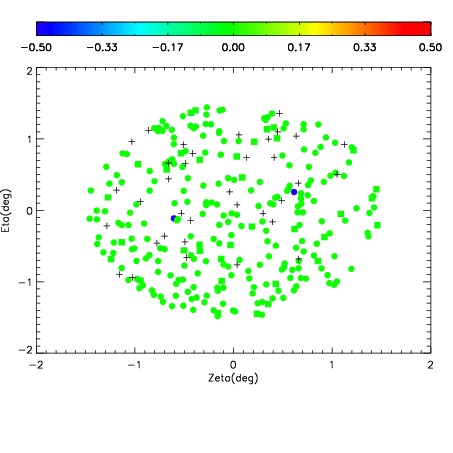
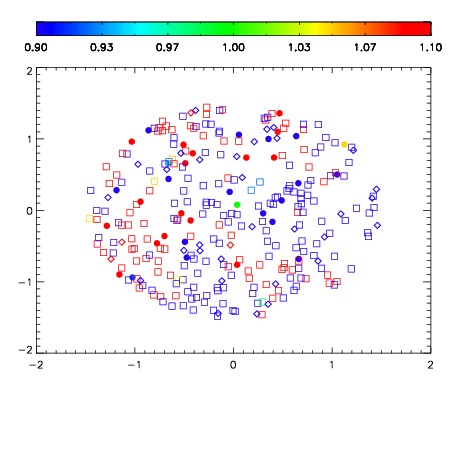
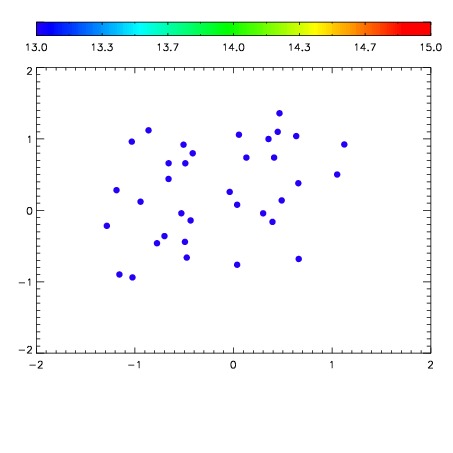

| Frame | Nreads | Zeropoints | Mag plots | Spatial mag deviation | Spatial sky 16325A emission deviations (filled: sky, open: star) | Spatial sky continuum emission | Spatial sky telluric CO2 absorption deviations (filled: H < 10) | |||||||||||||||||||||||
| 0 | 0 |
|
|
|
|
|
|
| IPAIR | NAME | SHIFT | NEWSHIFT | S/N | NAME | SHIFT | NEWSHIFT | S/N |
| 0 | 08410028 | 0.504446 | 0.00000 | 18.9682 | 08410029 | 0.00343434 | 0.501012 | 18.9686 |
| 1 | 08410031 | 0.502943 | 0.00150305 | 18.9502 | 08410030 | 0.00253348 | 0.501913 | 18.9399 |
| 2 | 08410032 | 0.503863 | 0.000583053 | 18.9178 | 08410026 | 0.00000 | 0.504446 | 18.9185 |
| 3 | 08410027 | 0.503299 | 0.00114703 | 18.9102 | 08410033 | 0.00467249 | 0.499774 | 18.8922 |