| Red | Green | Blue | |
| z | 17.64 | ||
| znorm | Inf | ||
| sky | -Inf | -Inf | -Inf |
| S/N | 21.0 | 38.2 | 40.5 |
| S/N(c) | 0.0 | 0.0 | 0.0 |
| SN(E/C) |
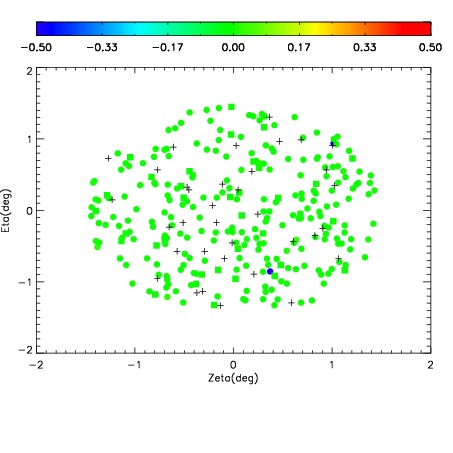
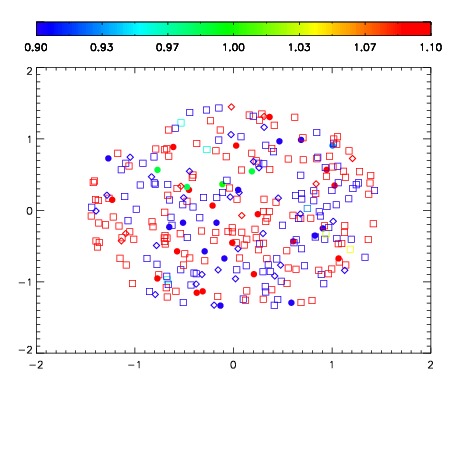


| Frame | Nreads | Zeropoints | Mag plots | Spatial mag deviation | Spatial sky 16325A emission deviations (filled: sky, open: star) | Spatial sky continuum emission | Spatial sky telluric CO2 absorption deviations (filled: H < 10) | |||||||||||||||||||||||
| 0 | 0 |
|
|
|
|
|
|
| IPAIR | NAME | SHIFT | NEWSHIFT | S/N | NAME | SHIFT | NEWSHIFT | S/N |
| 0 | 07830066 | 0.475816 | 0.00000 | 18.7795 | 07830067 | 0.00314573 | 0.472670 | 18.7346 |
| 1 | 07830065 | 0.474970 | 0.000845999 | 18.7875 | 07830064 | 0.00212669 | 0.473689 | 18.7615 |
| 2 | 07830062 | 0.475603 | 0.000212997 | 18.6944 | 07830063 | 0.00170909 | 0.474107 | 18.5999 |
| 3 | 07830061 | 0.474365 | 0.00145102 | 18.5826 | 07830060 | 0.00000 | 0.475816 | 18.5236 |