| Red | Green | Blue | |
| z | 17.64 | ||
| znorm | Inf | ||
| sky | -Inf | -Inf | -Inf |
| S/N | 25.2 | 42.5 | 45.1 |
| S/N(c) | 0.0 | 0.0 | 0.0 |
| SN(E/C) |


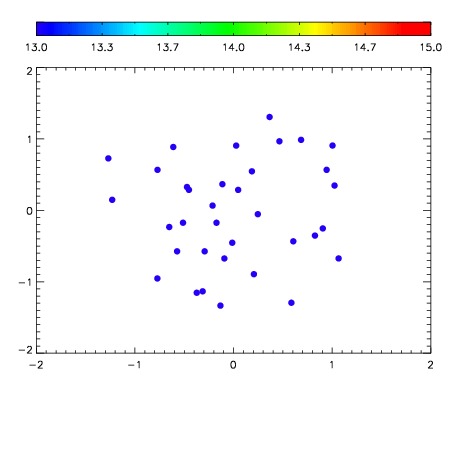

| Frame | Nreads | Zeropoints | Mag plots | Spatial mag deviation | Spatial sky 16325A emission deviations (filled: sky, open: star) | Spatial sky continuum emission | Spatial sky telluric CO2 absorption deviations (filled: H < 10) | |||||||||||||||||||||||
| 0 | 0 |
|
|
|
|
|
|
| IPAIR | NAME | SHIFT | NEWSHIFT | S/N | NAME | SHIFT | NEWSHIFT | S/N |
| 0 | 08400032 | 0.507563 | 0.00000 | 18.8805 | 08400026 | 0.00000 | 0.507563 | 18.9134 |
| 1 | 08400027 | 0.505815 | 0.00174797 | 19.0134 | 08400030 | 0.00823387 | 0.499329 | 19.0526 |
| 2 | 08400031 | 0.507033 | 0.000530005 | 18.9853 | 08400029 | 0.00853234 | 0.499031 | 18.9893 |
| 3 | 08400028 | 0.506734 | 0.000828981 | 18.9779 | 08400033 | 0.00791548 | 0.499648 | 18.9503 |