| Red | Green | Blue | |
| z | 17.64 | ||
| znorm | Inf | ||
| sky | -NaN | -NaN | -NaN |
| S/N | 27.2 | 46.1 | 49.6 |
| S/N(c) | 0.0 | 0.0 | 0.0 |
| SN(E/C) |
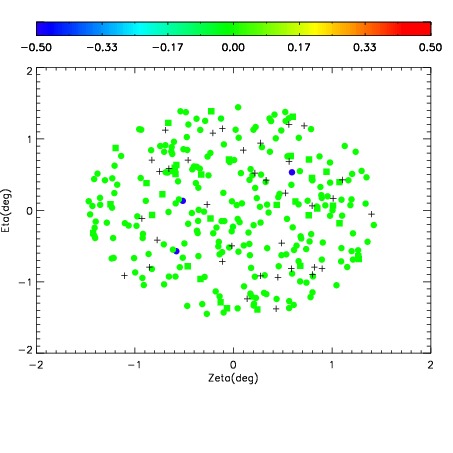

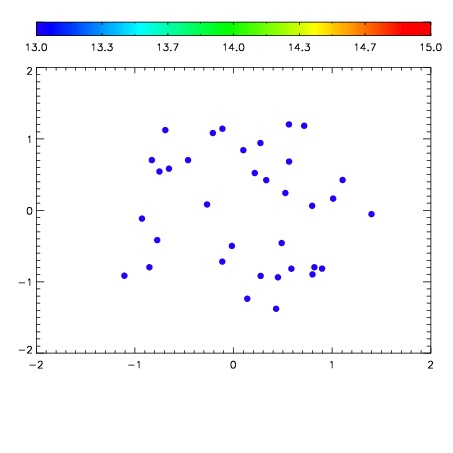

| Frame | Nreads | Zeropoints | Mag plots | Spatial mag deviation | Spatial sky 16325A emission deviations (filled: sky, open: star) | Spatial sky continuum emission | Spatial sky telluric CO2 absorption deviations (filled: H < 10) | |||||||||||||||||||||||
| 0 | 0 |
|
|
|
|
|
|
| IPAIR | NAME | SHIFT | NEWSHIFT | S/N | NAME | SHIFT | NEWSHIFT | S/N |
| 0 | 07870066 | 0.467352 | 0.00000 | 18.9917 | 07870071 | 0.000139277 | 0.467213 | 19.0067 |
| 1 | 07870069 | 0.466137 | 0.00121501 | 19.0367 | 07870068 | -0.00269426 | 0.470046 | 19.0296 |
| 2 | 07870070 | 0.466966 | 0.000386000 | 19.0047 | 07870067 | -0.00272245 | 0.470074 | 19.0174 |
| 3 | 07870065 | 0.465501 | 0.00185099 | 18.9881 | 07870064 | 0.00000 | 0.467352 | 18.9347 |