| Red | Green | Blue | |
| z | 17.64 | ||
| znorm | Inf | ||
| sky | -Inf | -NaN | -Inf |
| S/N | 27.8 | 46.2 | 49.4 |
| S/N(c) | 0.0 | 0.0 | 0.0 |
| SN(E/C) |
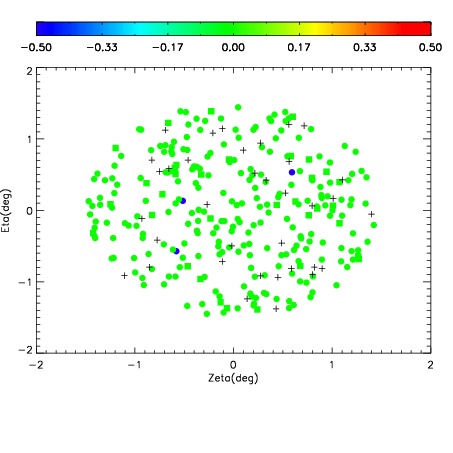
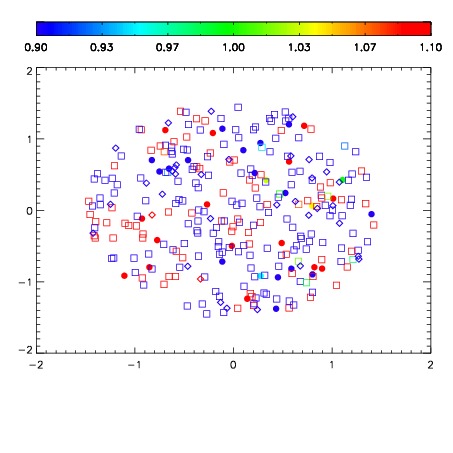
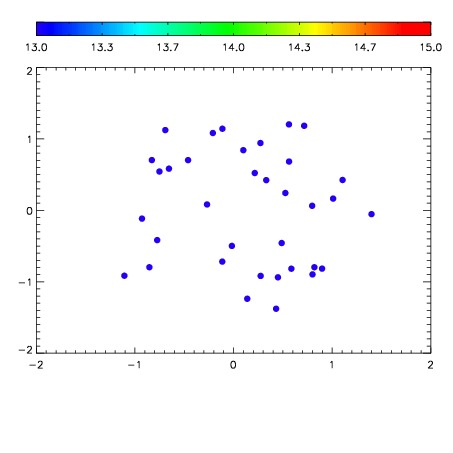

| Frame | Nreads | Zeropoints | Mag plots | Spatial mag deviation | Spatial sky 16325A emission deviations (filled: sky, open: star) | Spatial sky continuum emission | Spatial sky telluric CO2 absorption deviations (filled: H < 10) | |||||||||||||||||||||||
| 0 | 0 |
|
|
|
|
|
|
| IPAIR | NAME | SHIFT | NEWSHIFT | S/N | NAME | SHIFT | NEWSHIFT | S/N |
| 0 | 08400043 | 0.502678 | 0.00000 | 19.0199 | 08400040 | 0.00251547 | 0.500162 | 19.0309 |
| 1 | 08400042 | 0.501617 | 0.00106096 | 19.0193 | 08400044 | 0.00122553 | 0.501452 | 19.0100 |
| 2 | 08400039 | 0.502554 | 0.000123978 | 18.9782 | 08400041 | 5.44168e-05 | 0.502624 | 18.9510 |
| 3 | 08400038 | 0.502251 | 0.000426948 | 18.9465 | 08400037 | 0.00000 | 0.502678 | 18.8450 |