| Red | Green | Blue | |
| z | 17.63 | ||
| znorm | Inf | ||
| sky | -NaN | -NaN | -Inf |
| S/N | 21.3 | 36.9 | 39.0 |
| S/N(c) | 0.0 | 0.0 | 0.0 |
| SN(E/C) |
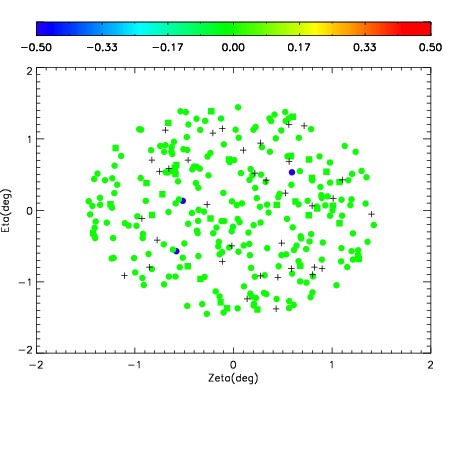
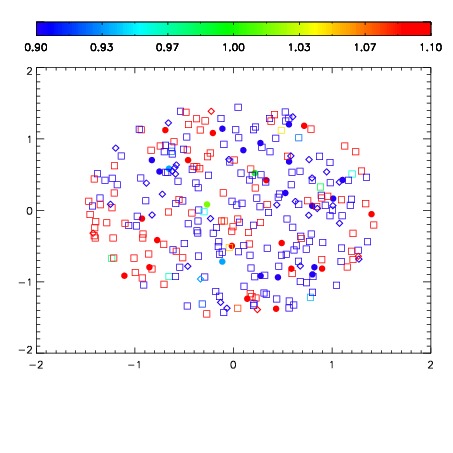
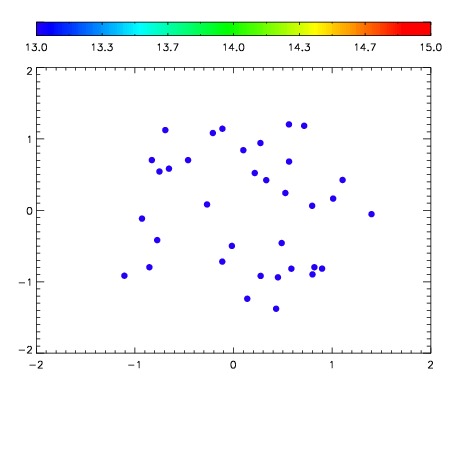

| Frame | Nreads | Zeropoints | Mag plots | Spatial mag deviation | Spatial sky 16325A emission deviations (filled: sky, open: star) | Spatial sky continuum emission | Spatial sky telluric CO2 absorption deviations (filled: H < 10) | |||||||||||||||||||||||
| 0 | 0 |
|
|
|
|
|
|
| IPAIR | NAME | SHIFT | NEWSHIFT | S/N | NAME | SHIFT | NEWSHIFT | S/N |
| 0 | 08440012 | 0.491717 | 0.00000 | 18.7899 | 08440010 | 0.00000 | 0.491717 | 18.7669 |
| 1 | 08440015 | 0.489184 | 0.00253302 | 18.8534 | 08440014 | 0.00154038 | 0.490177 | 18.8343 |
| 2 | 08440016 | 0.489818 | 0.00189900 | 18.8440 | 08440017 | 0.00385628 | 0.487861 | 18.7980 |
| 3 | 08440011 | 0.490924 | 0.000793010 | 18.8270 | 08440013 | 0.00549611 | 0.486221 | 18.7937 |