| Red | Green | Blue | |
| z | 17.64 | ||
| znorm | Inf | ||
| sky | -NaN | -Inf | -Inf |
| S/N | 14.8 | 23.4 | 26.8 |
| S/N(c) | 0.0 | 0.0 | 0.0 |
| SN(E/C) |


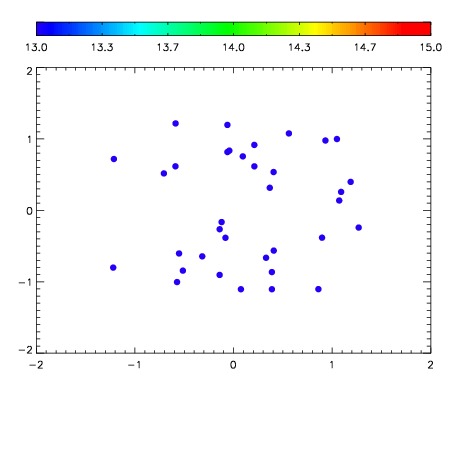

| Frame | Nreads | Zeropoints | Mag plots | Spatial mag deviation | Spatial sky 16325A emission deviations (filled: sky, open: star) | Spatial sky continuum emission | Spatial sky telluric CO2 absorption deviations (filled: H < 10) | |||||||||||||||||||||||
| 0 | 0 |
|
|
|
|
|
|
| IPAIR | NAME | SHIFT | NEWSHIFT | S/N | NAME | SHIFT | NEWSHIFT | S/N |
| 0 | 08170039 | 0.513689 | 0.00000 | 16.8364 | 08170040 | -0.000631548 | 0.514321 | 14.8325 |
| 1 | 08170035 | 0.512226 | 0.00146300 | 18.7657 | 08170033 | 0.00000 | 0.513689 | 18.9732 |
| 2 | 08170034 | 0.504412 | 0.00927699 | 18.7222 | 08170036 | -0.00151979 | 0.515209 | 18.6390 |
| 3 | 08170038 | 0.506234 | 0.00745499 | 17.5732 | 08170037 | -0.00247279 | 0.516162 | 18.0300 |