| Red | Green | Blue | |
| z | 17.64 | ||
| znorm | Inf | ||
| sky | -Inf | -Inf | -Inf |
| S/N | 24.2 | 40.6 | 42.0 |
| S/N(c) | 0.0 | 0.0 | 0.0 |
| SN(E/C) |

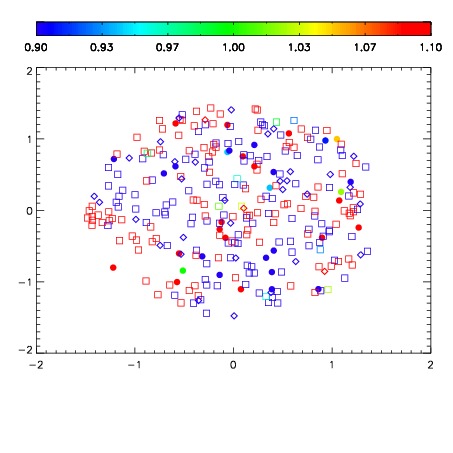


| Frame | Nreads | Zeropoints | Mag plots | Spatial mag deviation | Spatial sky 16325A emission deviations (filled: sky, open: star) | Spatial sky continuum emission | Spatial sky telluric CO2 absorption deviations (filled: H < 10) | |||||||||||||||||||||||
| 0 | 0 |
|
|
|
|
|
|
| IPAIR | NAME | SHIFT | NEWSHIFT | S/N | NAME | SHIFT | NEWSHIFT | S/N |
| 0 | 08440026 | 0.490102 | 0.00000 | 18.7028 | 08440025 | 0.00000 | 0.490102 | 18.8097 |
| 1 | 08440030 | 0.487556 | 0.00254598 | 19.0306 | 08440032 | 0.00725038 | 0.482852 | 19.0478 |
| 2 | 08440031 | 0.488828 | 0.00127399 | 19.0292 | 08440029 | 0.00350501 | 0.486597 | 18.9787 |
| 3 | 08440027 | 0.489694 | 0.000407994 | 18.9300 | 08440028 | 0.00559187 | 0.484510 | 18.9235 |