| Red | Green | Blue | |
| z | 17.64 | ||
| znorm | Inf | ||
| sky | -Inf | -NaN | -NaN |
| S/N | 22.2 | 38.2 | 39.7 |
| S/N(c) | 0.0 | 0.0 | 0.0 |
| SN(E/C) |
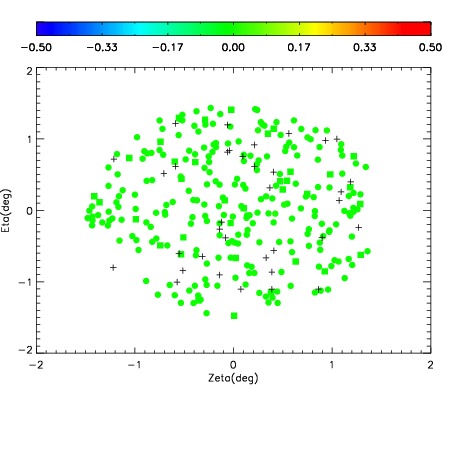
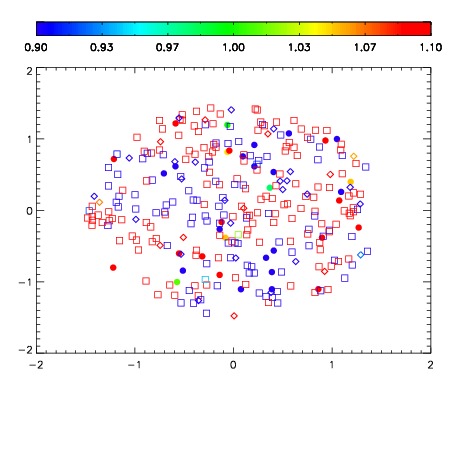
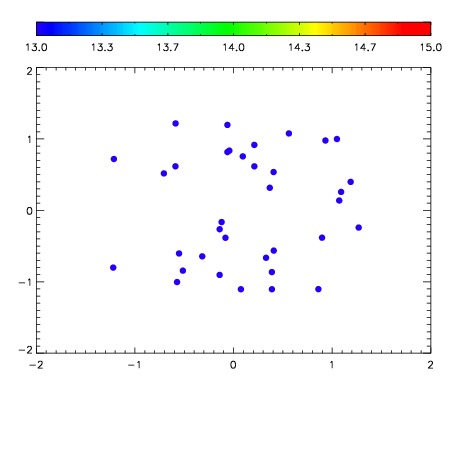

| Frame | Nreads | Zeropoints | Mag plots | Spatial mag deviation | Spatial sky 16325A emission deviations (filled: sky, open: star) | Spatial sky continuum emission | Spatial sky telluric CO2 absorption deviations (filled: H < 10) | |||||||||||||||||||||||
| 0 | 0 |
|
|
|
|
|
|
| IPAIR | NAME | SHIFT | NEWSHIFT | S/N | NAME | SHIFT | NEWSHIFT | S/N |
| 0 | 08480032 | 0.491010 | 0.00000 | 18.7604 | 08480029 | 0.00295218 | 0.488058 | 18.7819 |
| 1 | 08480028 | 0.490838 | 0.000172019 | 18.7976 | 08480033 | 0.00207320 | 0.488937 | 18.8506 |
| 2 | 08480031 | 0.489844 | 0.00116602 | 18.7963 | 08480030 | 0.00183071 | 0.489179 | 18.8484 |
| 3 | 08480027 | 0.490468 | 0.000542015 | 18.7831 | 08480026 | 0.00000 | 0.491010 | 18.8271 |