| Red | Green | Blue | |
| z | 17.64 | ||
| znorm | Inf | ||
| sky | -Inf | -NaN | -Inf |
| S/N | 17.8 | 30.4 | 32.8 |
| S/N(c) | 0.0 | 0.0 | 0.0 |
| SN(E/C) |


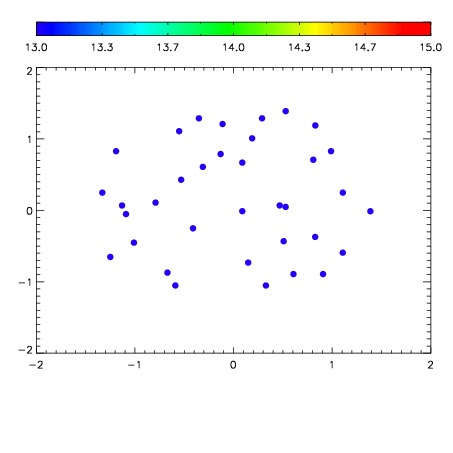

| Frame | Nreads | Zeropoints | Mag plots | Spatial mag deviation | Spatial sky 16325A emission deviations (filled: sky, open: star) | Spatial sky continuum emission | Spatial sky telluric CO2 absorption deviations (filled: H < 10) | |||||||||||||||||||||||
| 0 | 0 |
|
|
|
|
|
|
| IPAIR | NAME | SHIFT | NEWSHIFT | S/N | NAME | SHIFT | NEWSHIFT | S/N |
| 0 | 08470066 | 0.489598 | 0.00000 | 18.0954 | 08470063 | 0.00513010 | 0.484468 | 17.7641 |
| 1 | 08470061 | 0.486597 | 0.00300100 | 19.0061 | 08470060 | 0.00000 | 0.489598 | 19.0980 |
| 2 | 08470062 | 0.487632 | 0.00196600 | 18.8229 | 08470067 | 0.00409514 | 0.485503 | 17.9791 |
| 3 | 08470065 | 0.488502 | 0.00109601 | 18.0759 | 08470064 | 0.00323338 | 0.486365 | 17.7497 |