| Red | Green | Blue | |
| z | 17.64 | ||
| znorm | Inf | ||
| sky | -NaN | -NaN | -Inf |
| S/N | 21.6 | 37.5 | 40.3 |
| S/N(c) | 0.0 | 0.0 | 0.0 |
| SN(E/C) |


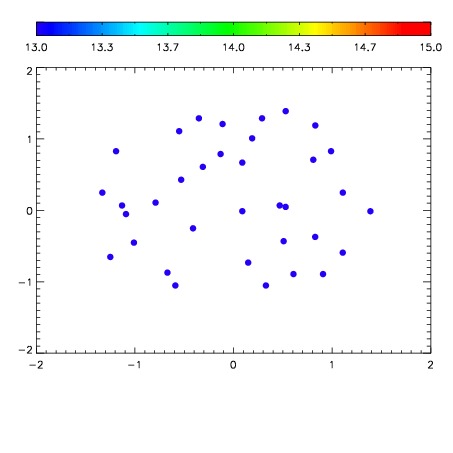

| Frame | Nreads | Zeropoints | Mag plots | Spatial mag deviation | Spatial sky 16325A emission deviations (filled: sky, open: star) | Spatial sky continuum emission | Spatial sky telluric CO2 absorption deviations (filled: H < 10) | |||||||||||||||||||||||
| 0 | 0 |
|
|
|
|
|
|
| IPAIR | NAME | SHIFT | NEWSHIFT | S/N | NAME | SHIFT | NEWSHIFT | S/N |
| 0 | 11380087 | 0.471735 | 0.00000 | 18.7407 | 11380088 | -0.00254832 | 0.474283 | 18.7440 |
| 1 | 11380083 | 0.471361 | 0.000373989 | 18.9034 | 11380084 | -0.00157769 | 0.473313 | 18.9315 |
| 2 | 11380082 | 0.470614 | 0.00112101 | 18.8133 | 11380085 | -0.00143554 | 0.473171 | 18.8508 |
| 3 | 11380086 | 0.470253 | 0.00148201 | 18.7591 | 11380081 | 0.00000 | 0.471735 | 18.7699 |