| Red | Green | Blue | |
| z | 17.64 | ||
| znorm | Inf | ||
| sky | -Inf | -Inf | -NaN |
| S/N | 24.4 | 42.3 | 46.8 |
| S/N(c) | 0.0 | 0.0 | 0.0 |
| SN(E/C) |
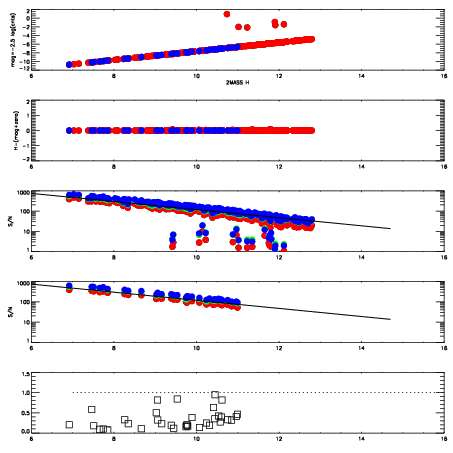
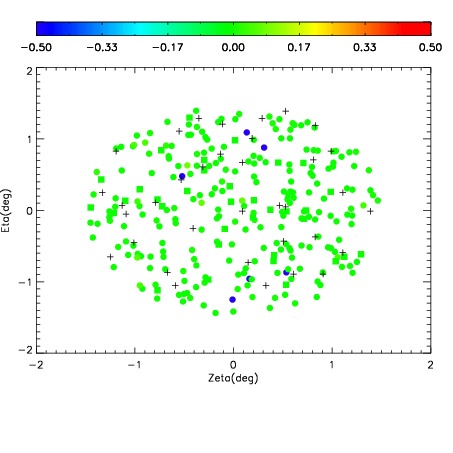
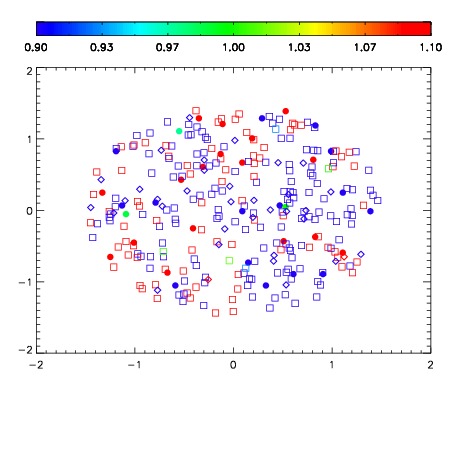
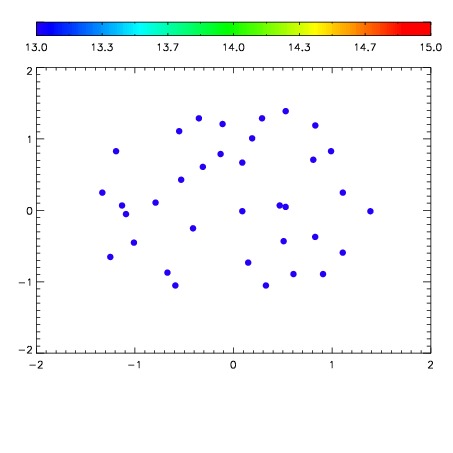

| Frame | Nreads | Zeropoints | Mag plots | Spatial mag deviation | Spatial sky 16325A emission deviations (filled: sky, open: star) | Spatial sky continuum emission | Spatial sky telluric CO2 absorption deviations (filled: H < 10) | |||||||||||||||||||||||
| 0 | 0 |
|
|
|
|
|
|
| IPAIR | NAME | SHIFT | NEWSHIFT | S/N | NAME | SHIFT | NEWSHIFT | S/N |
| 0 | 11470035 | 0.479527 | 0.00000 | 19.0300 | 11470037 | -0.00126613 | 0.480793 | 19.0112 |
| 1 | 11470039 | 0.479406 | 0.000120997 | 19.0699 | 11470036 | -0.00178348 | 0.481310 | 19.0450 |
| 2 | 11470034 | 0.478135 | 0.00139201 | 19.0692 | 11470033 | 0.00000 | 0.479527 | 19.0367 |
| 3 | 11470038 | 0.478932 | 0.000595003 | 19.0273 | 11470040 | -0.000775951 | 0.480303 | 18.9944 |