| Red | Green | Blue | |
| z | 17.64 | ||
| znorm | Inf | ||
| sky | -Inf | -NaN | -Inf |
| S/N | 25.8 | 45.8 | 48.4 |
| S/N(c) | 0.0 | 0.0 | 0.0 |
| SN(E/C) |
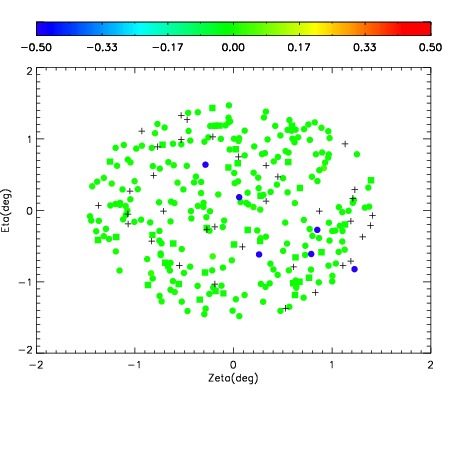
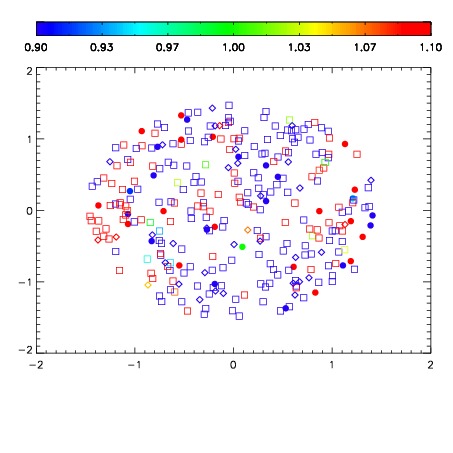
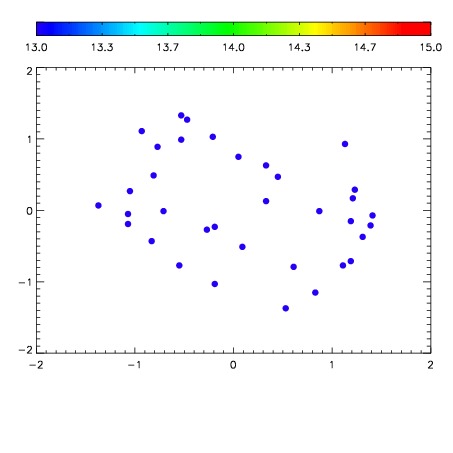

| Frame | Nreads | Zeropoints | Mag plots | Spatial mag deviation | Spatial sky 16325A emission deviations (filled: sky, open: star) | Spatial sky continuum emission | Spatial sky telluric CO2 absorption deviations (filled: H < 10) | |||||||||||||||||||||||
| 0 | 0 |
|
|
|
|
|
|
| IPAIR | NAME | SHIFT | NEWSHIFT | S/N | NAME | SHIFT | NEWSHIFT | S/N |
| 0 | 07920060 | 0.492980 | 0.00000 | 19.0516 | 07920062 | -0.00276638 | 0.495746 | 18.9889 |
| 1 | 07920061 | 0.492878 | 0.000102013 | 19.0788 | 07920059 | -0.00335324 | 0.496333 | 19.0355 |
| 2 | 07920057 | 0.490768 | 0.00221202 | 19.0060 | 07920055 | 0.00000 | 0.492980 | 18.9259 |
| 3 | 07920056 | 0.490776 | 0.00220400 | 18.9215 | 07920058 | -0.00225666 | 0.495237 | 18.8801 |