| Red | Green | Blue | |
| z | 17.64 | ||
| znorm | Inf | ||
| sky | -Inf | -Inf | -Inf |
| S/N | 18.0 | 31.4 | 33.3 |
| S/N(c) | 0.0 | 0.0 | 0.0 |
| SN(E/C) |
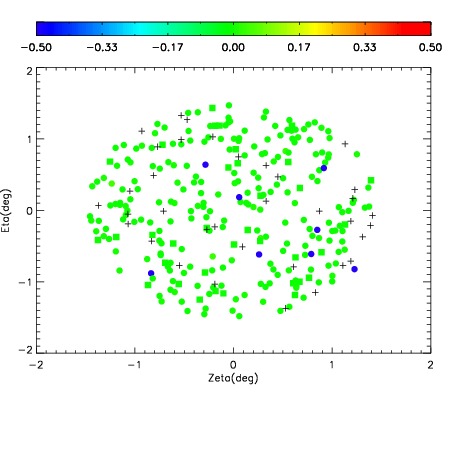
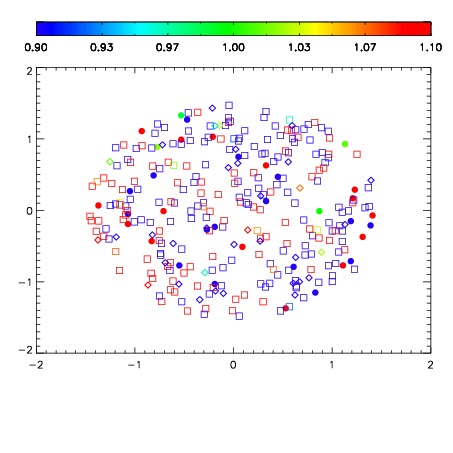


| Frame | Nreads | Zeropoints | Mag plots | Spatial mag deviation | Spatial sky 16325A emission deviations (filled: sky, open: star) | Spatial sky continuum emission | Spatial sky telluric CO2 absorption deviations (filled: H < 10) | |||||||||||||||||||||||
| 0 | 0 |
|
|
|
|
|
|
| IPAIR | NAME | SHIFT | NEWSHIFT | S/N | NAME | SHIFT | NEWSHIFT | S/N |
| 0 | 08220017 | 0.513164 | 0.00000 | 18.1583 | 08220011 | 0.00000 | 0.513164 | 18.7953 |
| 1 | 08220016 | 0.512312 | 0.000851989 | 18.9172 | 08220018 | 0.00208357 | 0.511080 | 19.0032 |
| 2 | 08220012 | 0.510576 | 0.00258797 | 18.0590 | 08220014 | 0.00130012 | 0.511864 | 18.7358 |
| 3 | 08220013 | 0.512185 | 0.000979006 | 17.8218 | 08220015 | 6.49691e-06 | 0.513157 | 18.6818 |