| Red | Green | Blue | |
| z | 17.64 | ||
| znorm | Inf | ||
| sky | -Inf | -Inf | -Inf |
| S/N | 22.3 | 37.6 | 39.7 |
| S/N(c) | 0.0 | 0.0 | 0.0 |
| SN(E/C) |
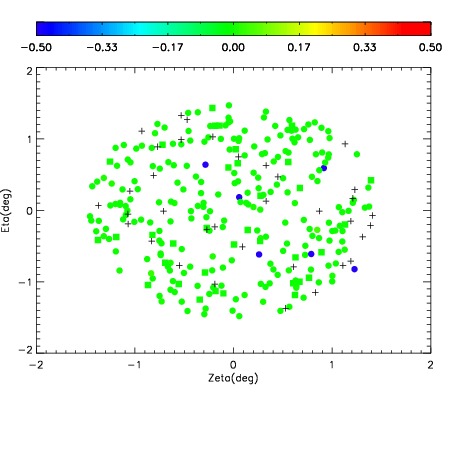
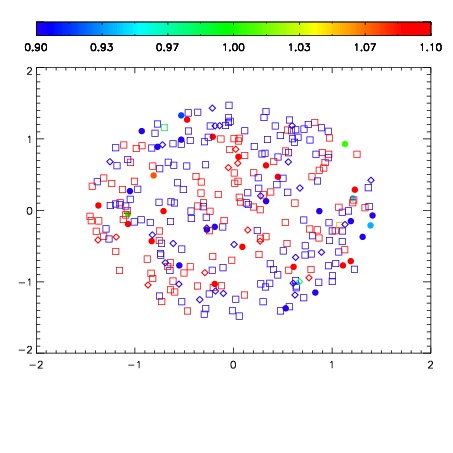


| Frame | Nreads | Zeropoints | Mag plots | Spatial mag deviation | Spatial sky 16325A emission deviations (filled: sky, open: star) | Spatial sky continuum emission | Spatial sky telluric CO2 absorption deviations (filled: H < 10) | |||||||||||||||||||||||
| 0 | 0 |
|
|
|
|
|
|
| IPAIR | NAME | SHIFT | NEWSHIFT | S/N | NAME | SHIFT | NEWSHIFT | S/N |
| 0 | 08460078 | 0.486680 | 0.00000 | 18.8748 | 08460076 | 0.00000 | 0.486680 | 18.8896 |
| 1 | 08460082 | 0.486403 | 0.000277013 | 18.8898 | 08460079 | 0.00424524 | 0.482435 | 18.9556 |
| 2 | 08460081 | 0.484011 | 0.00266901 | 18.8356 | 08460083 | 0.00468176 | 0.481998 | 18.8776 |
| 3 | 08460077 | 0.485130 | 0.00154999 | 18.8179 | 08460080 | 0.00415802 | 0.482522 | 18.8669 |