| Red | Green | Blue | |
| z | 17.64 | ||
| znorm | Inf | ||
| sky | -Inf | -Inf | -Inf |
| S/N | 22.2 | 41.9 | 45.3 |
| S/N(c) | 0.0 | 0.0 | 0.0 |
| SN(E/C) |
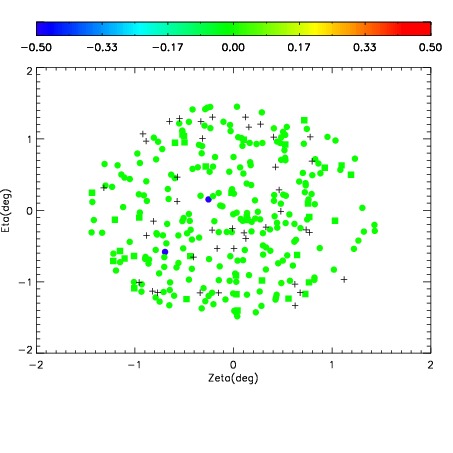
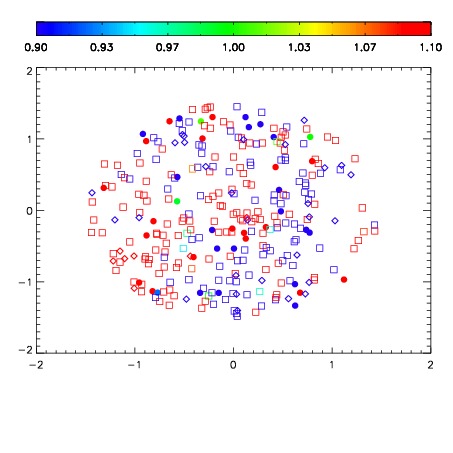
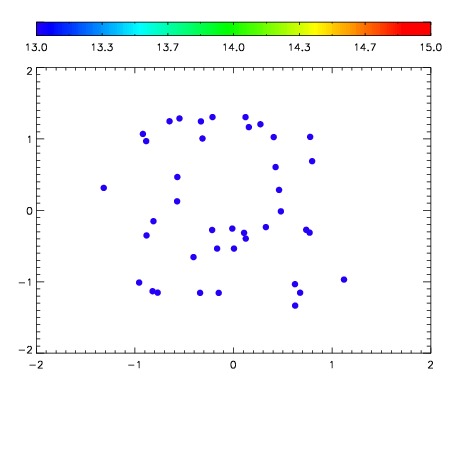

| Frame | Nreads | Zeropoints | Mag plots | Spatial mag deviation | Spatial sky 16325A emission deviations (filled: sky, open: star) | Spatial sky continuum emission | Spatial sky telluric CO2 absorption deviations (filled: H < 10) | |||||||||||||||||||||||
| 0 | 0 |
|
|
|
|
|
|
| IPAIR | NAME | SHIFT | NEWSHIFT | S/N | NAME | SHIFT | NEWSHIFT | S/N |
| 0 | 07610039 | 0.487080 | 0.00000 | 18.8399 | 07610041 | 0.00382266 | 0.483257 | 18.7254 |
| 1 | 07610042 | 0.485027 | 0.00205302 | 18.9078 | 07610044 | 0.00104008 | 0.486040 | 19.0314 |
| 2 | 07610043 | 0.485307 | 0.00177300 | 18.8519 | 07610040 | 8.80728e-06 | 0.487071 | 18.9273 |
| 3 | 07610038 | 0.486238 | 0.000842005 | 18.8446 | 07610037 | 0.00000 | 0.487080 | 18.8119 |