| Red | Green | Blue | |
| z | 17.64 | ||
| znorm | Inf | ||
| sky | -Inf | -Inf | -Inf |
| S/N | 25.6 | 44.5 | 48.4 |
| S/N(c) | 0.0 | 0.0 | 0.0 |
| SN(E/C) |

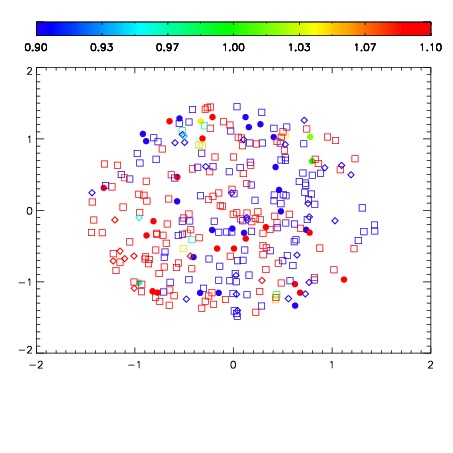


| Frame | Nreads | Zeropoints | Mag plots | Spatial mag deviation | Spatial sky 16325A emission deviations (filled: sky, open: star) | Spatial sky continuum emission | Spatial sky telluric CO2 absorption deviations (filled: H < 10) | |||||||||||||||||||||||
| 0 | 0 |
|
|
|
|
|
|
| IPAIR | NAME | SHIFT | NEWSHIFT | S/N | NAME | SHIFT | NEWSHIFT | S/N |
| 0 | 07870054 | 0.468737 | 0.00000 | 18.8228 | 07870053 | 0.00000 | 0.468737 | 18.9564 |
| 1 | 07870059 | 0.467492 | 0.00124499 | 19.0465 | 07870060 | -0.000563203 | 0.469300 | 19.0468 |
| 2 | 07870055 | 0.468307 | 0.000430018 | 19.0288 | 07870057 | -0.00309194 | 0.471829 | 19.0383 |
| 3 | 07870058 | 0.466403 | 0.00233400 | 19.0254 | 07870056 | -0.00110610 | 0.469843 | 18.9995 |