| Red | Green | Blue | |
| z | 17.64 | ||
| znorm | Inf | ||
| sky | -NaN | -Inf | -Inf |
| S/N | 27.5 | 43.6 | 47.0 |
| S/N(c) | 0.0 | 0.0 | 0.0 |
| SN(E/C) |
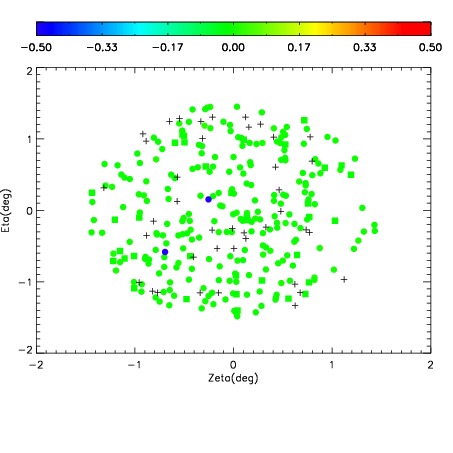
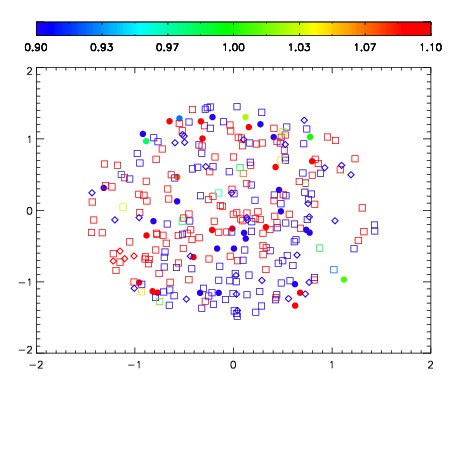
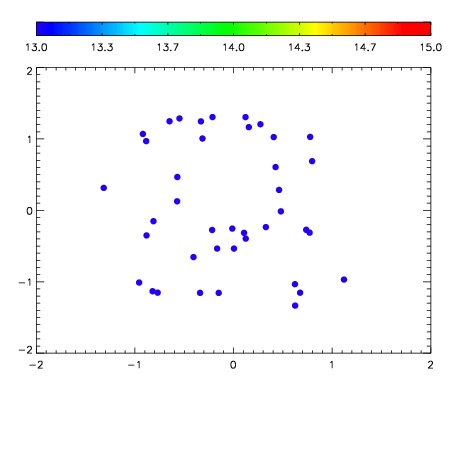

| Frame | Nreads | Zeropoints | Mag plots | Spatial mag deviation | Spatial sky 16325A emission deviations (filled: sky, open: star) | Spatial sky continuum emission | Spatial sky telluric CO2 absorption deviations (filled: H < 10) | |||||||||||||||||||||||
| 0 | 0 |
|
|
|
|
|
|
| IPAIR | NAME | SHIFT | NEWSHIFT | S/N | NAME | SHIFT | NEWSHIFT | S/N |
| 0 | 07910018 | 0.512182 | 0.00000 | 19.0070 | 07910012 | 0.00000 | 0.512182 | 18.9832 |
| 1 | 07910014 | 0.509776 | 0.00240600 | 19.0276 | 07910016 | 0.00486407 | 0.507318 | 19.0440 |
| 2 | 07910017 | 0.510197 | 0.00198501 | 19.0114 | 07910019 | 0.00761260 | 0.504569 | 19.0220 |
| 3 | 07910013 | 0.509101 | 0.00308102 | 19.0099 | 07910015 | 0.00500173 | 0.507180 | 19.0026 |