| Red | Green | Blue | |
| z | 17.64 | ||
| znorm | Inf | ||
| sky | -Inf | -Inf | -Inf |
| S/N | 22.9 | 38.8 | 42.2 |
| S/N(c) | 0.0 | 0.0 | 0.0 |
| SN(E/C) |
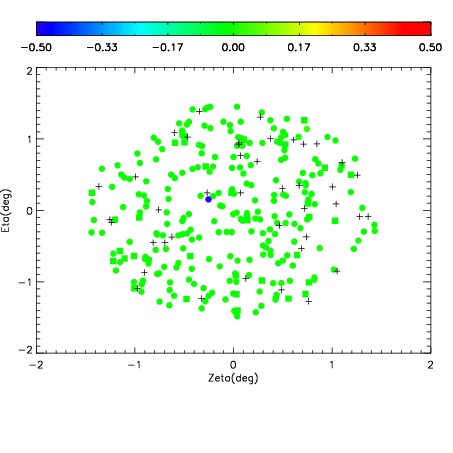
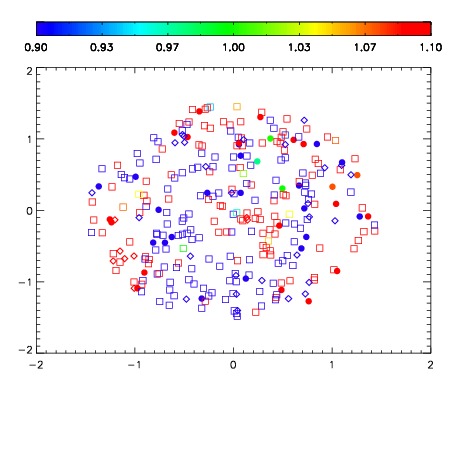
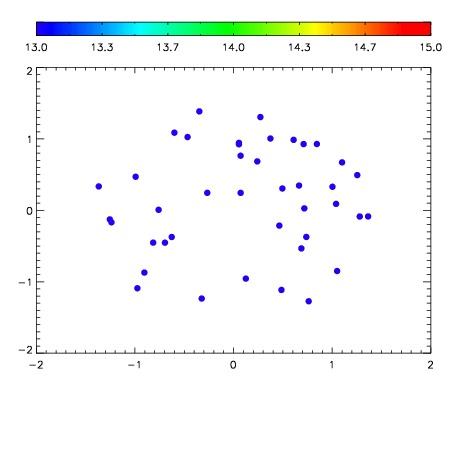

| Frame | Nreads | Zeropoints | Mag plots | Spatial mag deviation | Spatial sky 16325A emission deviations (filled: sky, open: star) | Spatial sky continuum emission | Spatial sky telluric CO2 absorption deviations (filled: H < 10) | |||||||||||||||||||||||
| 0 | 0 |
|
|
|
|
|
|
| IPAIR | NAME | SHIFT | NEWSHIFT | S/N | NAME | SHIFT | NEWSHIFT | S/N |
| 0 | 07620017 | 0.484995 | 0.00000 | 18.7957 | 07620018 | 0.000225401 | 0.484770 | 18.6868 |
| 1 | 07620012 | 0.481135 | 0.00386000 | 18.9240 | 07620011 | 0.00000 | 0.484995 | 18.8608 |
| 2 | 07620016 | 0.484141 | 0.000854015 | 18.8274 | 07620015 | -0.00183077 | 0.486826 | 18.7498 |
| 3 | 07620013 | 0.483219 | 0.00177601 | 18.5534 | 07620014 | -2.58473e-06 | 0.484998 | 18.6825 |