| Red | Green | Blue | |
| z | 17.64 | ||
| znorm | Inf | ||
| sky | -Inf | -Inf | -Inf |
| S/N | 23.6 | 37.7 | 41.8 |
| S/N(c) | 0.0 | 0.0 | 0.0 |
| SN(E/C) |
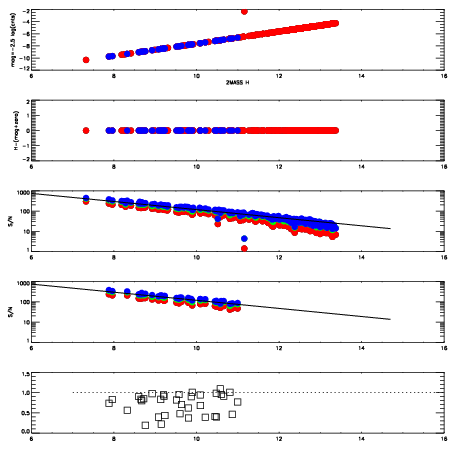


| Frame | Nreads | Zeropoints | Mag plots | Spatial mag deviation | Spatial sky 16325A emission deviations (filled: sky, open: star) | Spatial sky continuum emission | Spatial sky telluric CO2 absorption deviations (filled: H < 10) | |||||||||||||||||||||||
| 0 | 0 |
|
|
|
|
|
|
| IPAIR | NAME | SHIFT | NEWSHIFT | S/N | NAME | SHIFT | NEWSHIFT | S/N |
| 0 | 07900032 | 0.472250 | 0.00000 | 18.4414 | 07900029 | 0.00193216 | 0.470318 | 18.9171 |
| 1 | 07900028 | 0.471622 | 0.000628024 | 18.8762 | 07900030 | -0.000206742 | 0.472457 | 18.9702 |
| 2 | 07900027 | 0.471007 | 0.00124303 | 18.8274 | 07900026 | 0.00000 | 0.472250 | 18.9585 |
| 3 | 07900031 | 0.471950 | 0.000300020 | 18.4325 | 07900033 | 5.37818e-05 | 0.472196 | 18.7530 |