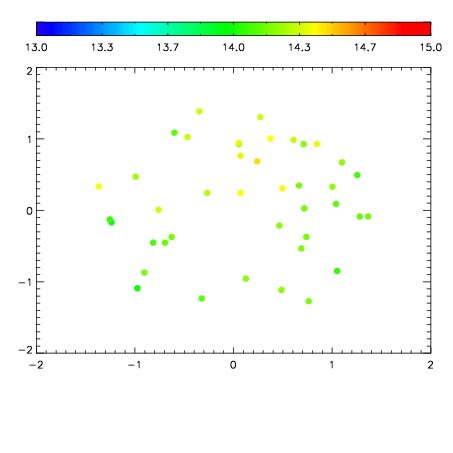
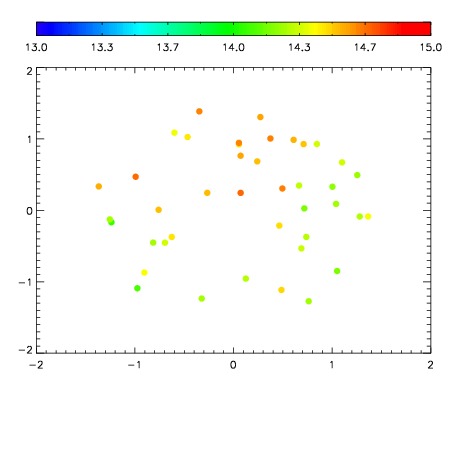
| Frame | Nreads | Zeropoints | Mag plots
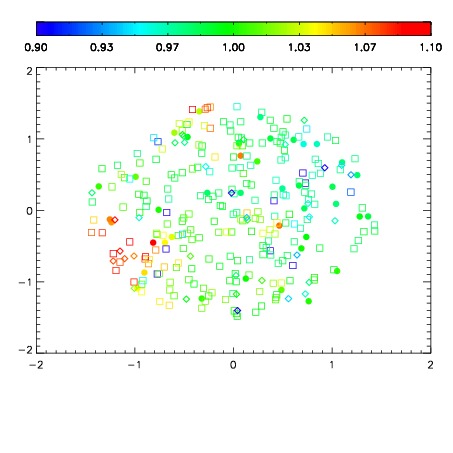
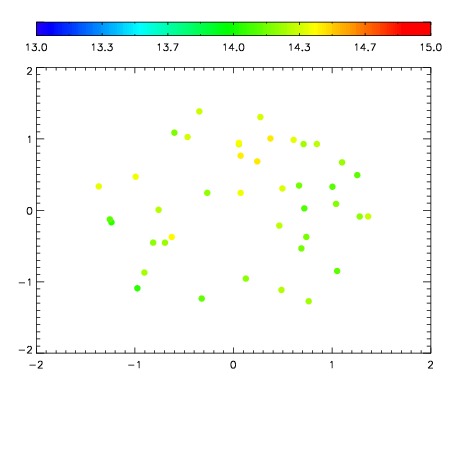
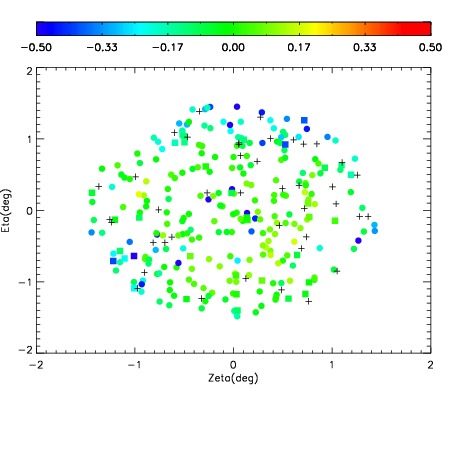
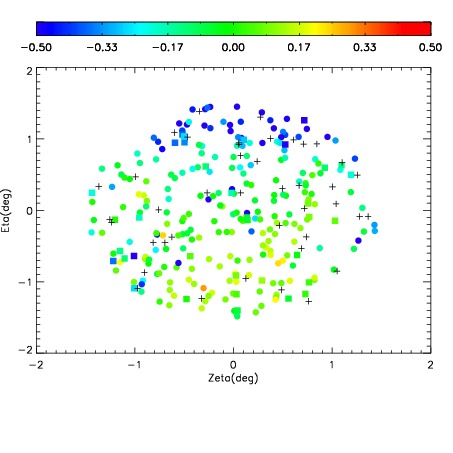
| Spatial mag deviation
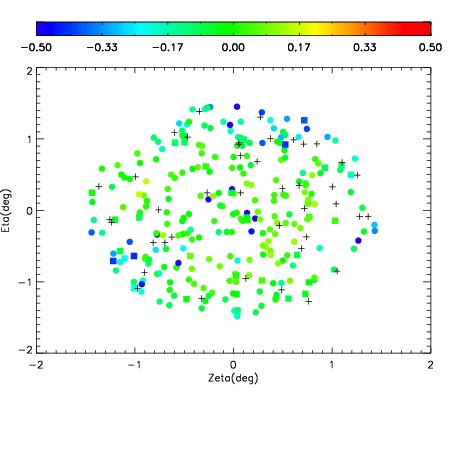
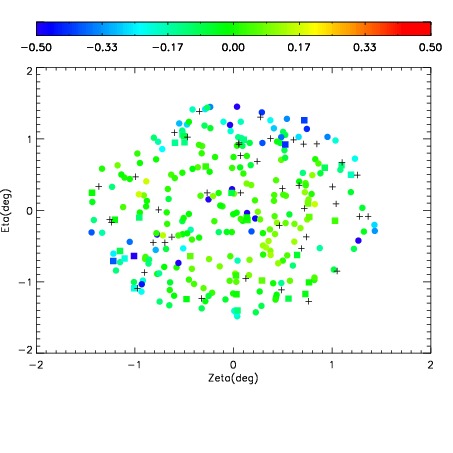
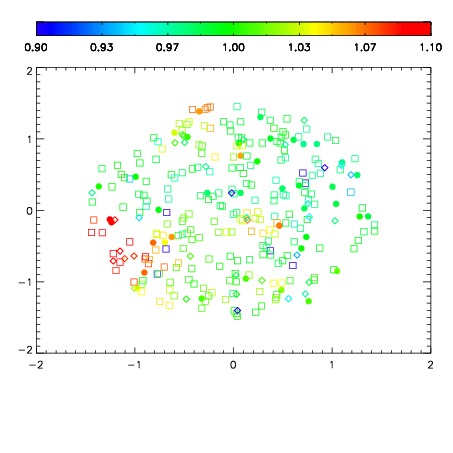
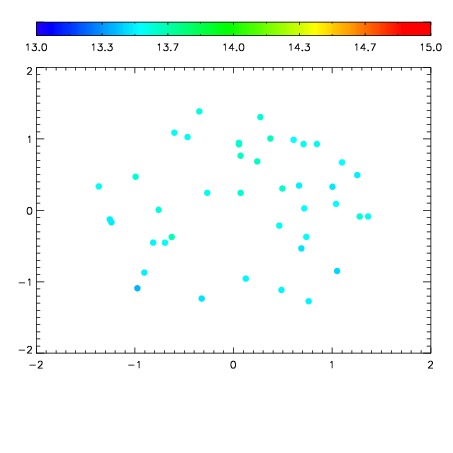
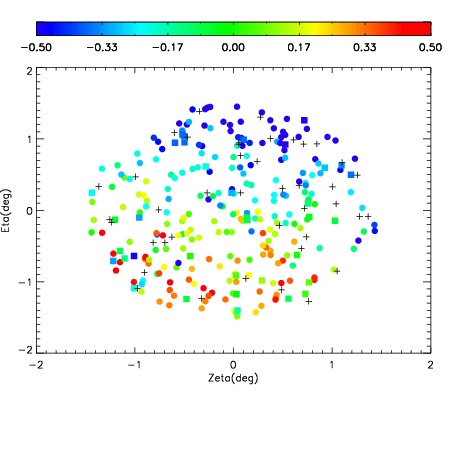
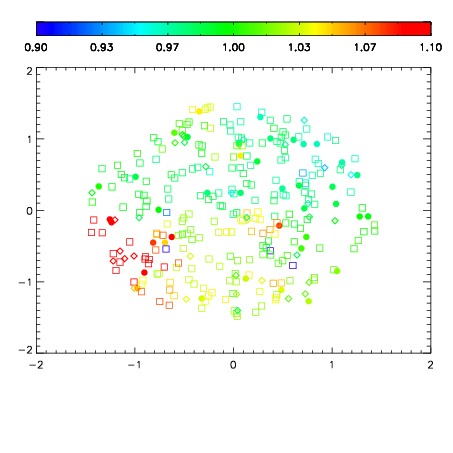
| Spatial sky 16325A emission deviations (filled: sky, open: star)
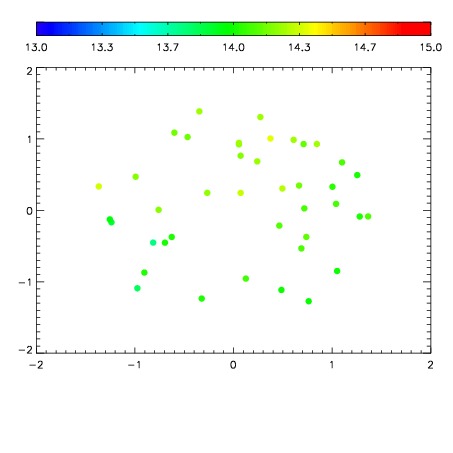
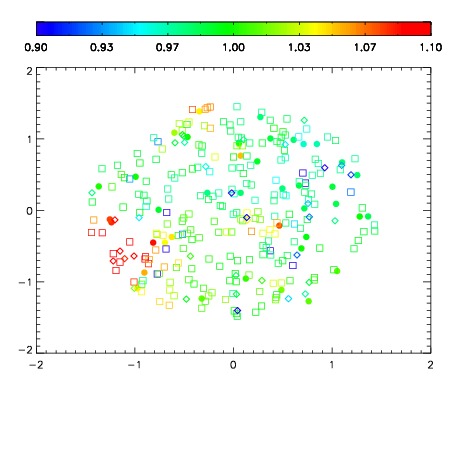
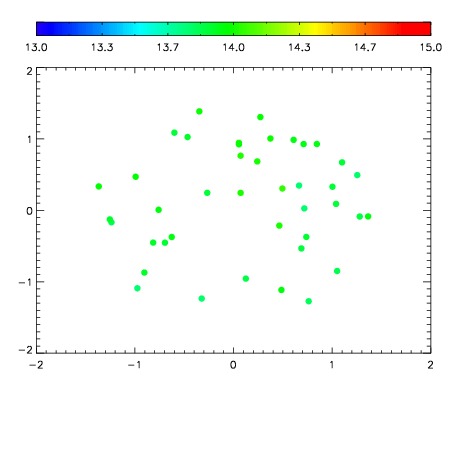
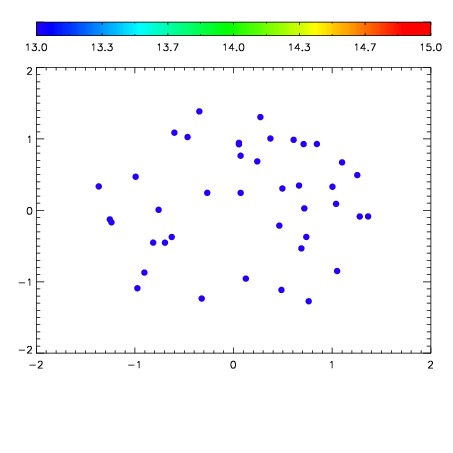
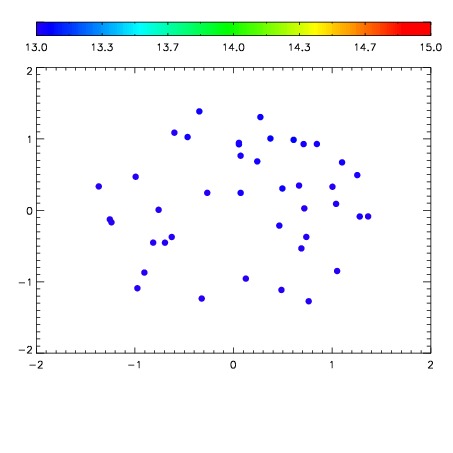
| Spatial sky continuum emission
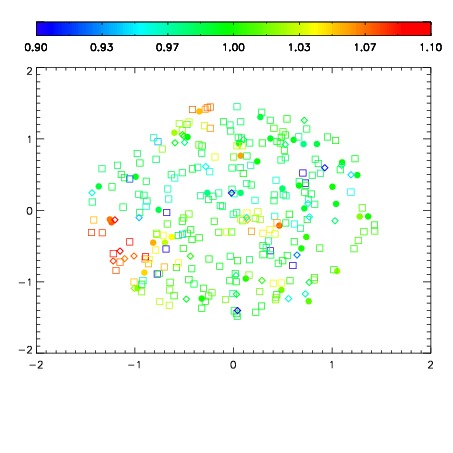
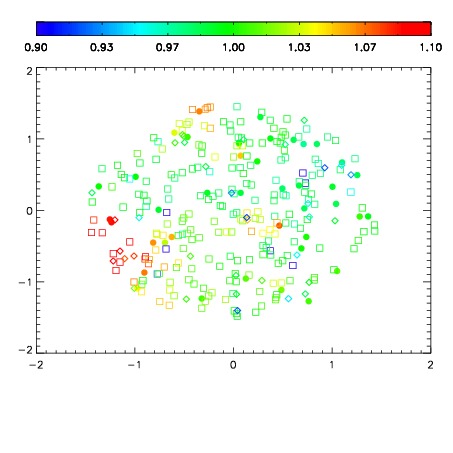
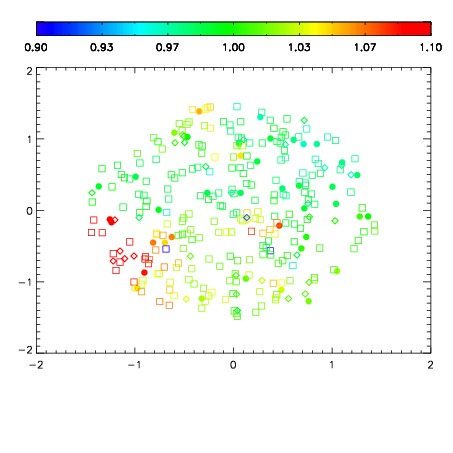
| Spatial sky telluric CO2 absorption deviations (filled: H < 10)
|
| 8100026
| 47
| | Red | Green | Blue
| | z | | 18.95
| | znorm | | 14.77
| | sky | 14.4 | 14.1 | 14.0
| | S/N | 14.6 | 22.2 | 23.0
| | S/N(c) | 24.3 | 41.0 | 19.1
| | SN(E/C) 0.69
|
| 
| 
| 
| 
| 
|
| 8100027
| 47
| | Red | Green | Blue
| | z | | 19.03
| | znorm | | 14.85
| | sky | 14.6 | 14.2 | 14.4
| | S/N | 15.9 | 23.4 | 24.7
| | S/N(c) | 25.3 | 42.5 | 19.9
| | SN(E/C) 0.68
|
| 
| 
| 
| 
| 
|
| 8100028
| 47
| | Red | Green | Blue
| | z | | 19.09
| | znorm | | 14.91
| | sky | 14.7 | 14.4 | 14.6
| | S/N | 16.4 | 24.3 | 26.1
| | S/N(c) | 26.2 | 43.9 | 20.5
| | SN(E/C) 0.70
|
| 
| 
| 
| 
| 
|
| 8100029
| 47
| | Red | Green | Blue
| | z | | 19.01
| | znorm | | 14.83
| | sky | 14.6 | 14.3 | 14.4
| | S/N | 15.2 | 23.0 | 24.9
| | S/N(c) | 25.0 | 41.8 | 19.6
| | SN(E/C) 0.67
|
| 
| 
| 
| 
| 
|
| 8100030
| 47
| | Red | Green | Blue
| | z | | 18.87
| | znorm | | 14.69
| | sky | 14.0 | 13.9 | 14.0
| | S/N | 13.9 | 20.8 | 22.9
| | S/N(c) | 22.8 | 38.5 | 18.0
| | SN(E/C) 0.73
|
| 
| 
| 
| 
| 
|
| 8100031
| 47
| | Red | Green | Blue
| | z | | 18.56
| | znorm | | 14.38
| | sky | 13.7 | 13.5 | 13.6
| | S/N | 10.9 | 16.9 | 18.9
| | S/N(c) | 18.2 | 32.1 | 15.1
| | SN(E/C) 0.82
|
| 
| 
| 
| 
| 
|
| 8100032
| 47
| | Red | Green | Blue
| | z | | 16.69
| | znorm | | 12.51
| | sky | 12.9 | 12.9 | 12.9
| | S/N | 1.8 | 3.9 | 4.5
| | S/N(c) | 3.8 | 8.2 | 3.9
| | SN(E/C) 1.02
|
| 
| 
| 
| 
| 
|
| 8100033
| 47
| | Red | Green | Blue
| | z | | 17.57
| | znorm | | 13.39
| | sky | 13.1 | 13.0 | 13.0
| | S/N | 4.0 | 7.5 | 9.9
| | S/N(c) | 8.7 | 16.7 | 7.7
| | SN(E/C) 0.94
|
| 
| 
| 
| 
| 
|