| Red | Green | Blue | |
| z | 17.64 | ||
| znorm | Inf | ||
| sky | -Inf | -Inf | -Inf |
| S/N | 22.6 | 35.1 | 39.0 |
| S/N(c) | 0.0 | 0.0 | 0.0 |
| SN(E/C) |
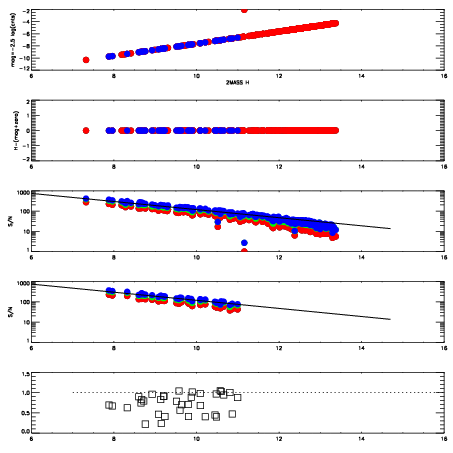


| Frame | Nreads | Zeropoints | Mag plots | Spatial mag deviation | Spatial sky 16325A emission deviations (filled: sky, open: star) | Spatial sky continuum emission | Spatial sky telluric CO2 absorption deviations (filled: H < 10) | |||||||||||||||||||||||
| 0 | 0 |
|
|
|
|
|
|
| IPAIR | NAME | SHIFT | NEWSHIFT | S/N | NAME | SHIFT | NEWSHIFT | S/N |
| 0 | 08100032 | 0.522332 | 0.00000 | 16.5280 | 08100033 | -0.000745922 | 0.523078 | 17.5118 |
| 1 | 08100028 | 0.520105 | 0.00222701 | 19.0795 | 08100029 | -0.00199518 | 0.524327 | 18.9946 |
| 2 | 08100027 | 0.516471 | 0.00586098 | 19.0198 | 08100026 | 0.00000 | 0.522332 | 18.9290 |
| 3 | 08100031 | 0.514513 | 0.00781900 | 18.5506 | 08100030 | -0.00247464 | 0.524807 | 18.8505 |