| Red | Green | Blue | |
| z | 17.64 | ||
| znorm | Inf | ||
| sky | -NaN | -NaN | -Inf |
| S/N | 20.1 | 35.4 | 37.7 |
| S/N(c) | 0.0 | 0.0 | 0.0 |
| SN(E/C) |
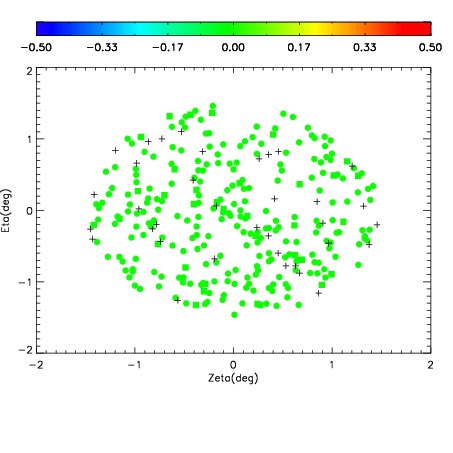
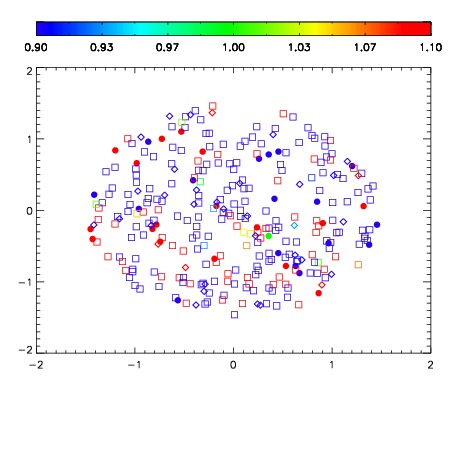


| Frame | Nreads | Zeropoints | Mag plots | Spatial mag deviation | Spatial sky 16325A emission deviations (filled: sky, open: star) | Spatial sky continuum emission | Spatial sky telluric CO2 absorption deviations (filled: H < 10) | |||||||||||||||||||||||
| 0 | 0 |
|
|
|
|
|
|
| IPAIR | NAME | SHIFT | NEWSHIFT | S/N | NAME | SHIFT | NEWSHIFT | S/N |
| 0 | 08780024 | 0.476226 | 0.00000 | 18.1064 | 08780023 | 0.00000 | 0.476226 | 18.0518 |
| 1 | 08780028 | 0.475011 | 0.00121501 | 18.6239 | 08780027 | 0.000932619 | 0.475293 | 19.0173 |
| 2 | 08780025 | 0.476102 | 0.000124007 | 18.6157 | 08780026 | 0.00150734 | 0.474719 | 18.8291 |
| 3 | 08780029 | 0.475177 | 0.00104901 | 18.5071 | 08780030 | -0.00226699 | 0.478493 | 18.7070 |