| Red | Green | Blue | |
| z | 17.64 | ||
| znorm | Inf | ||
| sky | -Inf | -Inf | -Inf |
| S/N | 9.2 | 16.2 | 17.6 |
| S/N(c) | 0.0 | 0.0 | 0.0 |
| SN(E/C) |
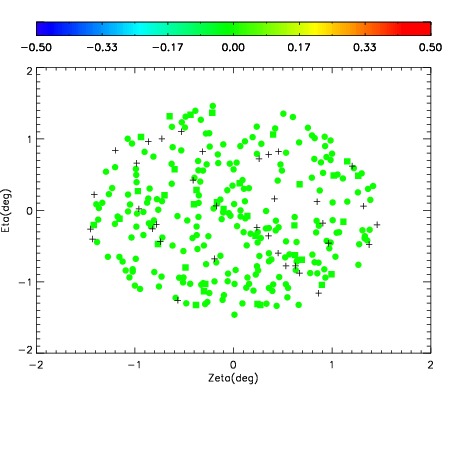
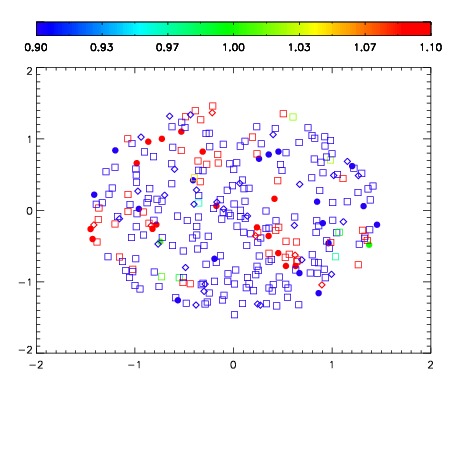
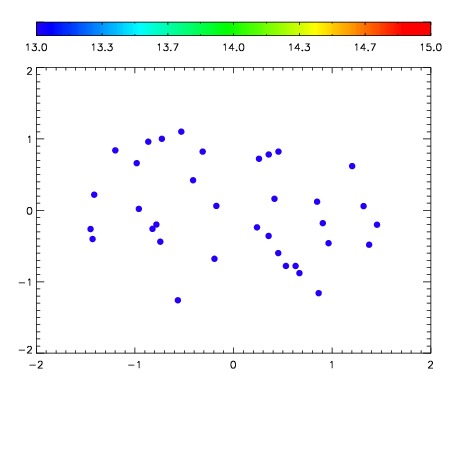

| Frame | Nreads | Zeropoints | Mag plots | Spatial mag deviation | Spatial sky 16325A emission deviations (filled: sky, open: star) | Spatial sky continuum emission | Spatial sky telluric CO2 absorption deviations (filled: H < 10) | |||||||||||||||||||||||
| 0 | 0 |
|
|
|
|
|
|
| IPAIR | NAME | SHIFT | NEWSHIFT | S/N | NAME | SHIFT | NEWSHIFT | S/N |
| 0 | 09060027 | 0.486928 | 0.00000 | 16.9312 | 09060026 | 0.00302103 | 0.483907 | 17.9791 |
| 1 | 09060023 | 0.480833 | 0.00609499 | 18.2025 | 09060022 | 0.00000 | 0.486928 | 18.6815 |
| 2 | 09060028 | 0.486288 | 0.000639975 | 16.9089 | 09060025 | 0.00543525 | 0.481493 | 15.9894 |
| 3 | 09060024 | 0.485518 | 0.00140998 | 16.1520 | 09060029 | 0.00977983 | 0.477148 | 15.6480 |