| Red | Green | Blue | |
| z | 17.64 | ||
| znorm | Inf | ||
| sky | -Inf | -NaN | -NaN |
| S/N | 23.2 | 40.0 | 42.2 |
| S/N(c) | 0.0 | 0.0 | 0.0 |
| SN(E/C) |
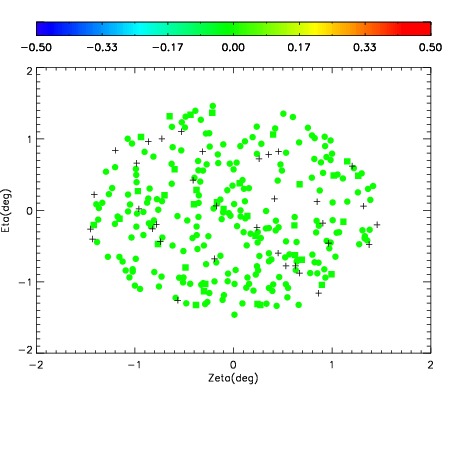

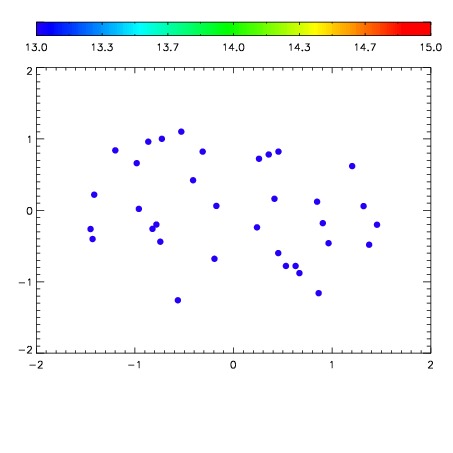

| Frame | Nreads | Zeropoints | Mag plots | Spatial mag deviation | Spatial sky 16325A emission deviations (filled: sky, open: star) | Spatial sky continuum emission | Spatial sky telluric CO2 absorption deviations (filled: H < 10) | |||||||||||||||||||||||
| 0 | 0 |
|
|
|
|
|
|
| IPAIR | NAME | SHIFT | NEWSHIFT | S/N | NAME | SHIFT | NEWSHIFT | S/N |
| 0 | 11490013 | 0.473668 | 0.00000 | 18.7618 | 11490018 | 0.000872086 | 0.472796 | 18.7543 |
| 1 | 11490012 | 0.473606 | 6.20186e-05 | 18.8478 | 11490015 | -0.00341340 | 0.477081 | 18.8141 |
| 2 | 11490017 | 0.472342 | 0.00132599 | 18.8399 | 11490011 | 0.00000 | 0.473668 | 18.7613 |
| 3 | 11490016 | 0.472054 | 0.00161400 | 18.6512 | 11490014 | -0.00334470 | 0.477013 | 18.7542 |