| Red | Green | Blue | |
| z | 17.64 | ||
| znorm | Inf | ||
| sky | -Inf | -Inf | -Inf |
| S/N | 26.8 | 45.0 | 47.7 |
| S/N(c) | 0.0 | 0.0 | 0.0 |
| SN(E/C) |
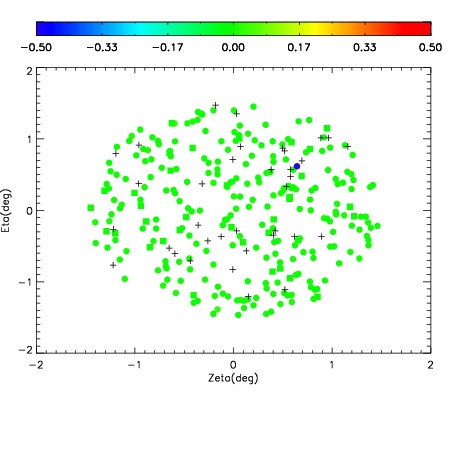
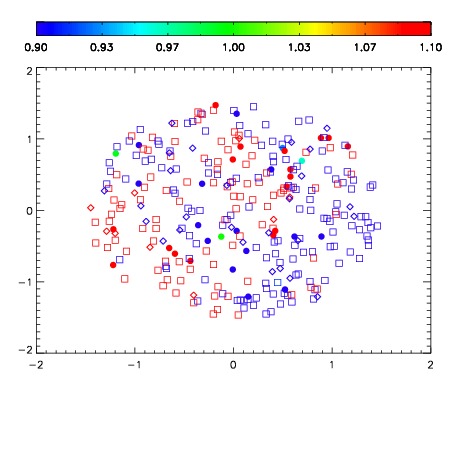


| Frame | Nreads | Zeropoints | Mag plots | Spatial mag deviation | Spatial sky 16325A emission deviations (filled: sky, open: star) | Spatial sky continuum emission | Spatial sky telluric CO2 absorption deviations (filled: H < 10) | |||||||||||||||||||||||
| 0 | 0 |
|
|
|
|
|
|
| IPAIR | NAME | SHIFT | NEWSHIFT | S/N | NAME | SHIFT | NEWSHIFT | S/N |
| 0 | 09070016 | 0.484100 | 0.00000 | 18.9889 | 09070010 | 0.00000 | 0.484100 | 19.0032 |
| 1 | 09070015 | 0.483421 | 0.000679016 | 19.0318 | 09070014 | 0.000363777 | 0.483736 | 19.0551 |
| 2 | 09070012 | 0.482293 | 0.00180700 | 19.0295 | 09070013 | 0.000930124 | 0.483170 | 19.0418 |
| 3 | 09070011 | 0.482535 | 0.00156501 | 19.0079 | 09070017 | 0.000348358 | 0.483752 | 19.0077 |