| Red | Green | Blue | |
| z | 17.65 | ||
| znorm | Inf | ||
| sky | -Inf | -Inf | -Inf |
| S/N | 1.8 | 3.3 | 4.5 |
| S/N(c) | 0.0 | 0.0 | 0.0 |
| SN(E/C) |
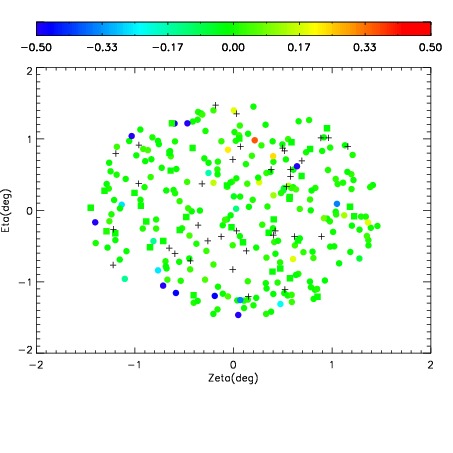
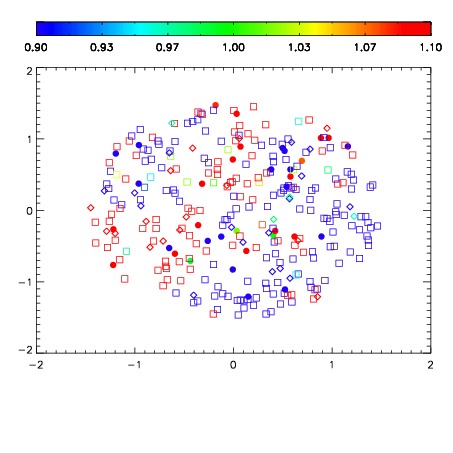


| Frame | Nreads | Zeropoints | Mag plots | Spatial mag deviation | Spatial sky 16325A emission deviations (filled: sky, open: star) | Spatial sky continuum emission | Spatial sky telluric CO2 absorption deviations (filled: H < 10) | |||||||||||||||||||||||
| 0 | 0 |
|
|
|
|
|
|
| IPAIR | NAME | SHIFT | NEWSHIFT | S/N | NAME | SHIFT | NEWSHIFT | S/N |
| 0 | 11420077 | 0.483489 | 0.00000 | 14.4877 | 11420079 | -0.00131205 | 0.484801 | 15.5006 |
| 1 | 11420084 | 0.482478 | 0.00101101 | 15.6245 | 11420075 | 0.00000 | 0.483489 | 16.5769 |
| 2 | 11420085 | 0.482599 | 0.000890017 | 15.6131 | 11420083 | -0.00145115 | 0.484940 | 15.8592 |
| 3 | 11420080 | 0.482651 | 0.000838012 | 15.2660 | 11420082 | -0.00152195 | 0.485011 | 15.6598 |
| 4 | 11420081 | 0.482476 | 0.00101301 | 14.3527 | 11420086 | -0.00101752 | 0.484507 | 14.8227 |