| Red | Green | Blue | |
| z | 17.64 | ||
| znorm | Inf | ||
| sky | -Inf | -Inf | -NaN |
| S/N | 17.9 | 32.4 | 33.6 |
| S/N(c) | 0.0 | 0.0 | 0.0 |
| SN(E/C) |
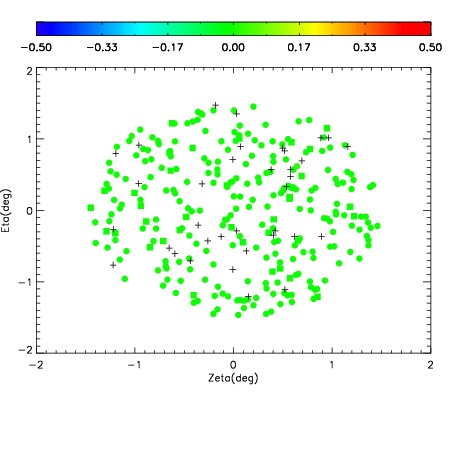
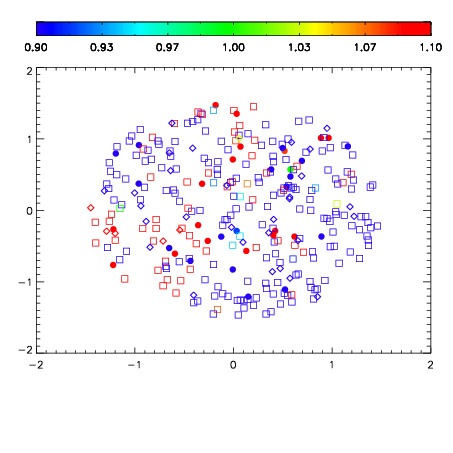


| Frame | Nreads | Zeropoints | Mag plots | Spatial mag deviation | Spatial sky 16325A emission deviations (filled: sky, open: star) | Spatial sky continuum emission | Spatial sky telluric CO2 absorption deviations (filled: H < 10) | |||||||||||||||||||||||
| 0 | 0 |
|
|
|
|
|
|
| IPAIR | NAME | SHIFT | NEWSHIFT | S/N | NAME | SHIFT | NEWSHIFT | S/N |
| 0 | 11460026 | 0.478868 | 0.00000 | 18.3677 | 11460027 | -0.00301274 | 0.481881 | 18.4288 |
| 1 | 11460030 | 0.477836 | 0.00103199 | 18.4372 | 11460031 | -0.00268364 | 0.481552 | 18.5616 |
| 2 | 11460029 | 0.477201 | 0.00166699 | 18.4312 | 11460028 | -0.00295616 | 0.481824 | 18.5532 |
| 3 | 11460025 | 0.478744 | 0.000124007 | 18.1931 | 11460024 | 0.00000 | 0.478868 | 18.3698 |