| Red | Green | Blue | |
| z | 17.64 | ||
| znorm | Inf | ||
| sky | -Inf | -NaN | -Inf |
| S/N | 11.6 | 19.7 | 22.2 |
| S/N(c) | 0.0 | 0.0 | 0.0 |
| SN(E/C) |
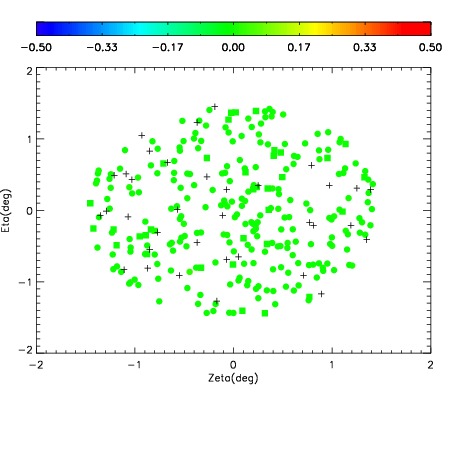
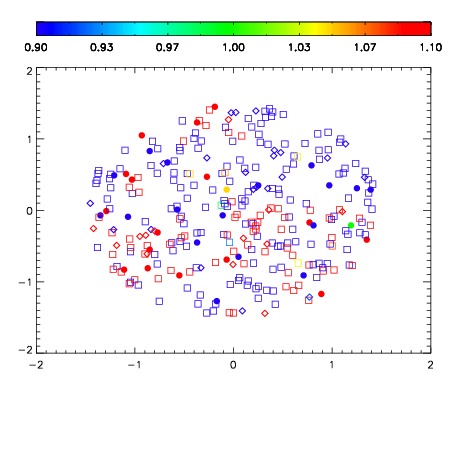
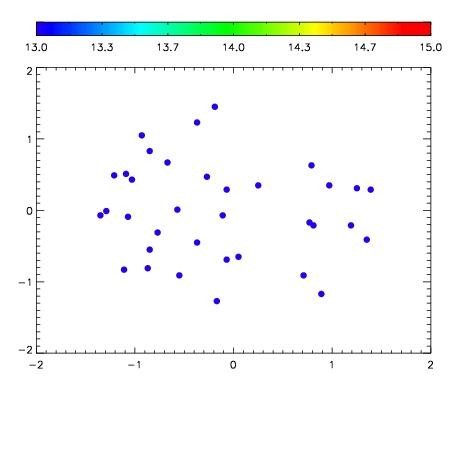

| Frame | Nreads | Zeropoints | Mag plots | Spatial mag deviation | Spatial sky 16325A emission deviations (filled: sky, open: star) | Spatial sky continuum emission | Spatial sky telluric CO2 absorption deviations (filled: H < 10) | |||||||||||||||||||||||
| 0 | 0 |
|
|
|
|
|
|
| IPAIR | NAME | SHIFT | NEWSHIFT | S/N | NAME | SHIFT | NEWSHIFT | S/N |
| 0 | 12030076 | 0.500946 | 0.00000 | 18.2343 | 12030077 | -0.00147280 | 0.502419 | 18.2304 |
| 1 | 12030075 | 0.500845 | 0.000100970 | 18.0614 | 12030070 | 0.00000 | 0.500946 | 18.0495 |
| 2 | 12030071 | 0.499582 | 0.00136399 | 17.9557 | 12030074 | -0.000844690 | 0.501791 | 18.0253 |
| 3 | 12030072 | 0.500139 | 0.000806987 | 17.8613 | 12030073 | -0.00124474 | 0.502191 | 18.0105 |