| Red | Green | Blue | |
| z | 17.64 | ||
| znorm | Inf | ||
| sky | -Inf | -Inf | -Inf |
| S/N | 30.9 | 50.1 | 53.1 |
| S/N(c) | 0.0 | 0.0 | 0.0 |
| SN(E/C) |
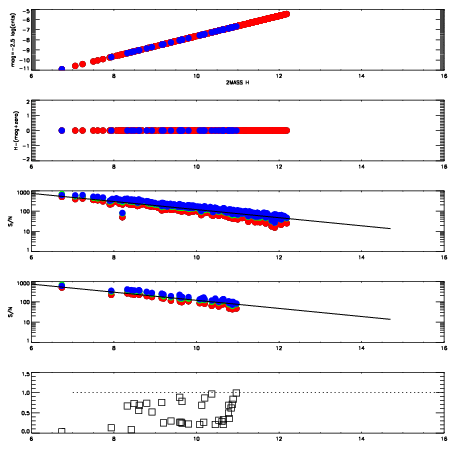
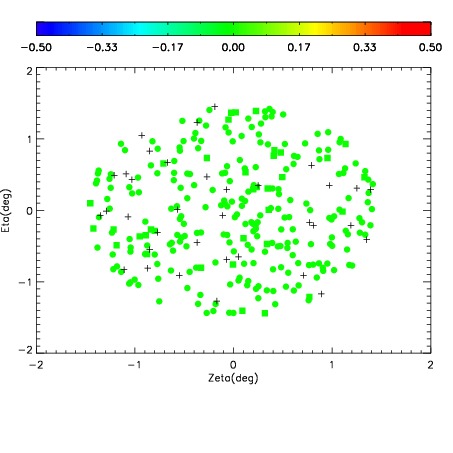
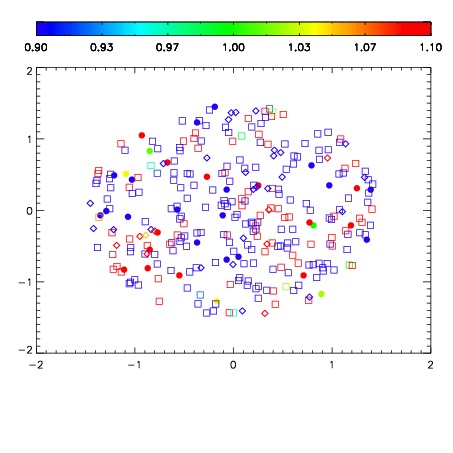
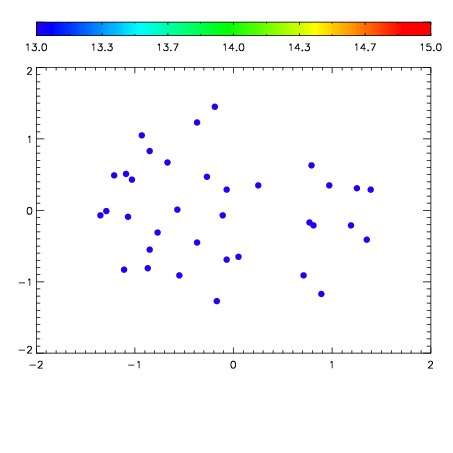

| Frame | Nreads | Zeropoints | Mag plots | Spatial mag deviation | Spatial sky 16325A emission deviations (filled: sky, open: star) | Spatial sky continuum emission | Spatial sky telluric CO2 absorption deviations (filled: H < 10) | |||||||||||||||||||||||
| 0 | 0 |
|
|
|
|
|
|
| IPAIR | NAME | SHIFT | NEWSHIFT | S/N | NAME | SHIFT | NEWSHIFT | S/N |
| 0 | 12100085 | 0.497129 | 0.00000 | 19.0756 | 12100083 | 0.00000 | 0.497129 | 19.0429 |
| 1 | 12100089 | 0.492565 | 0.00456399 | 19.1247 | 12100087 | -0.00522711 | 0.502356 | 19.1307 |
| 2 | 12100088 | 0.492498 | 0.00463098 | 19.1157 | 12100090 | -0.00742796 | 0.504557 | 19.1175 |
| 3 | 12100084 | 0.497029 | 9.99868e-05 | 19.0845 | 12100086 | -0.00489009 | 0.502019 | 19.1157 |