| Red | Green | Blue | |
| z | 17.64 | ||
| znorm | Inf | ||
| sky | -Inf | -NaN | -Inf |
| S/N | 17.9 | 33.1 | 35.0 |
| S/N(c) | 0.0 | 0.0 | 0.0 |
| SN(E/C) |
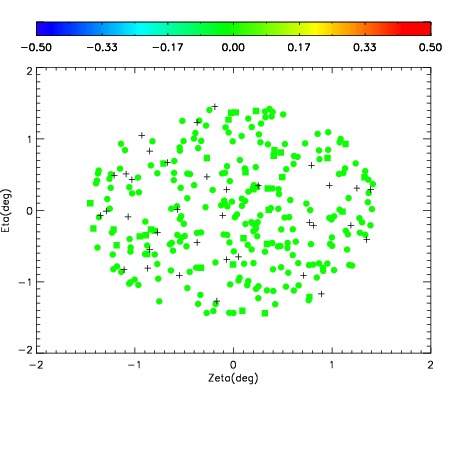
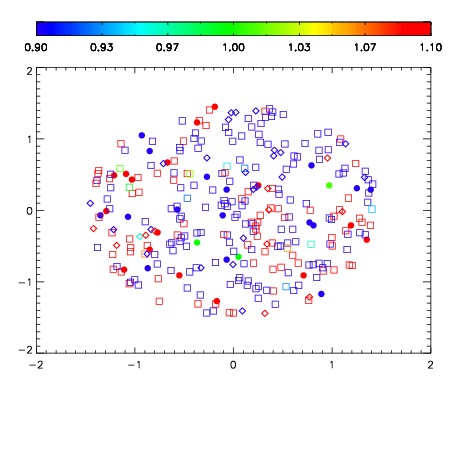
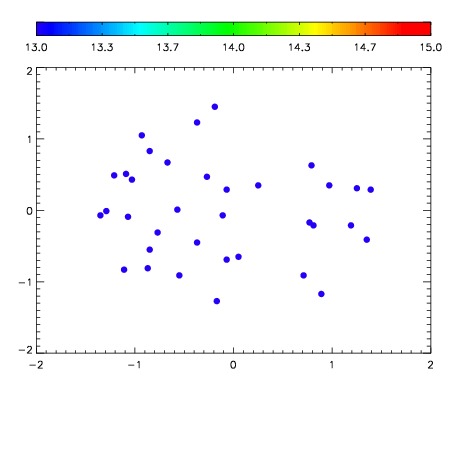

| Frame | Nreads | Zeropoints | Mag plots | Spatial mag deviation | Spatial sky 16325A emission deviations (filled: sky, open: star) | Spatial sky continuum emission | Spatial sky telluric CO2 absorption deviations (filled: H < 10) | |||||||||||||||||||||||
| 0 | 0 |
|
|
|
|
|
|
| IPAIR | NAME | SHIFT | NEWSHIFT | S/N | NAME | SHIFT | NEWSHIFT | S/N |
| 0 | 12140064 | 0.497434 | 0.00000 | 17.9301 | 12140065 | 0.000450426 | 0.496984 | 18.1727 |
| 1 | 12140059 | 0.492623 | 0.00481099 | 18.6216 | 12140058 | 0.00000 | 0.497434 | 18.5838 |
| 2 | 12140060 | 0.492965 | 0.00446898 | 18.5352 | 12140061 | 0.00200667 | 0.495427 | 18.5416 |
| 3 | 12140063 | 0.496226 | 0.00120798 | 18.0310 | 12140062 | 0.00260672 | 0.494827 | 18.3615 |