| Red | Green | Blue | |
| z | 17.64 | ||
| znorm | Inf | ||
| sky | -NaN | -Inf | -Inf |
| S/N | 20.4 | 37.5 | 39.2 |
| S/N(c) | 0.0 | 0.0 | 0.0 |
| SN(E/C) |
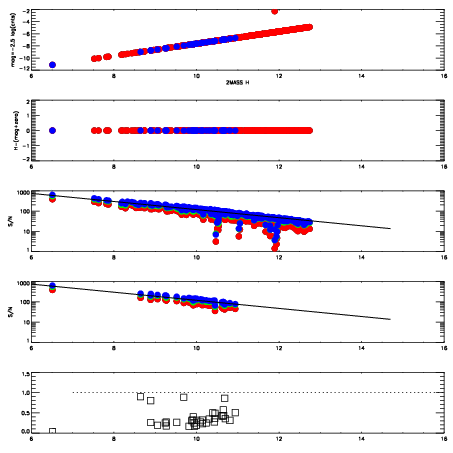
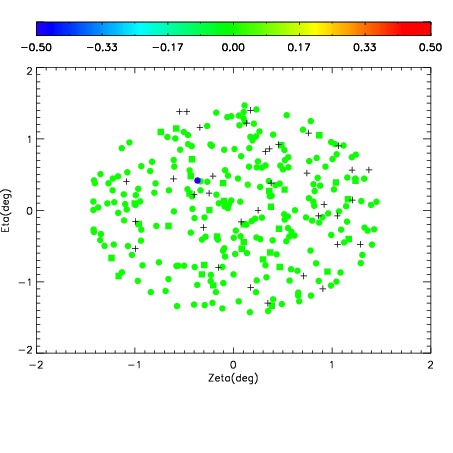
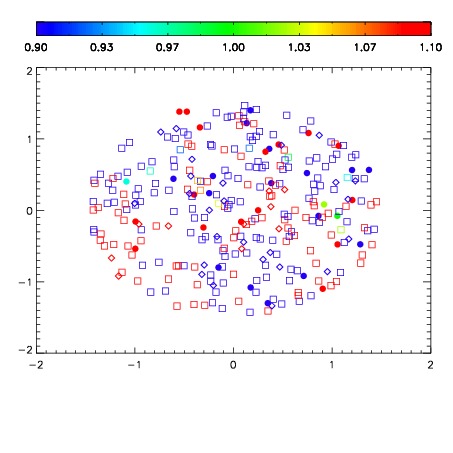
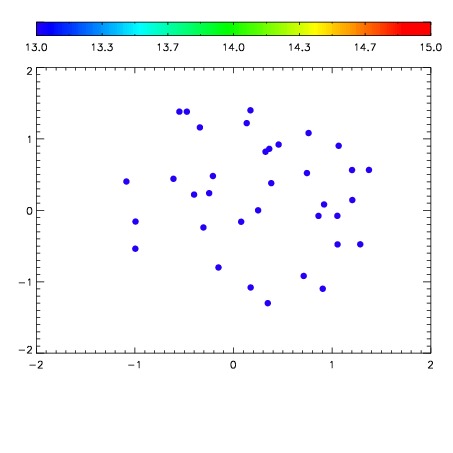

| Frame | Nreads | Zeropoints | Mag plots | Spatial mag deviation | Spatial sky 16325A emission deviations (filled: sky, open: star) | Spatial sky continuum emission | Spatial sky telluric CO2 absorption deviations (filled: H < 10) | |||||||||||||||||||||||
| 0 | 0 |
|
|
|
|
|
|
| IPAIR | NAME | SHIFT | NEWSHIFT | S/N | NAME | SHIFT | NEWSHIFT | S/N |
| 0 | 08700043 | 0.478372 | 0.00000 | 18.5698 | 08700037 | 0.00000 | 0.478372 | 18.4756 |
| 1 | 08700039 | 0.477884 | 0.000488013 | 18.6628 | 08700041 | 0.000803313 | 0.477569 | 18.7032 |
| 2 | 08700042 | 0.478213 | 0.000158995 | 18.6485 | 08700040 | 0.00114879 | 0.477223 | 18.6696 |
| 3 | 08700038 | 0.476961 | 0.00141102 | 18.5716 | 08700044 | 0.00272719 | 0.475645 | 18.5388 |