| Red | Green | Blue | |
| z | 17.64 | ||
| znorm | Inf | ||
| sky | -Inf | -NaN | -Inf |
| S/N | 26.2 | 45.5 | 48.2 |
| S/N(c) | 0.0 | 0.0 | 0.0 |
| SN(E/C) |
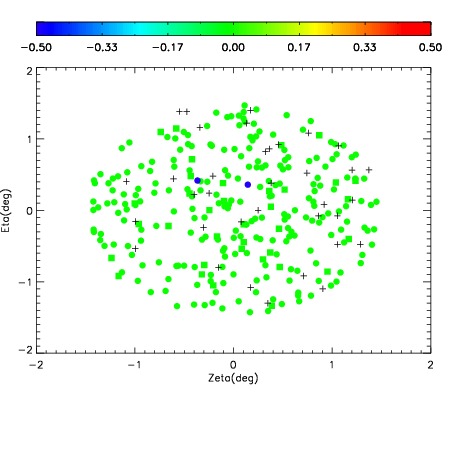
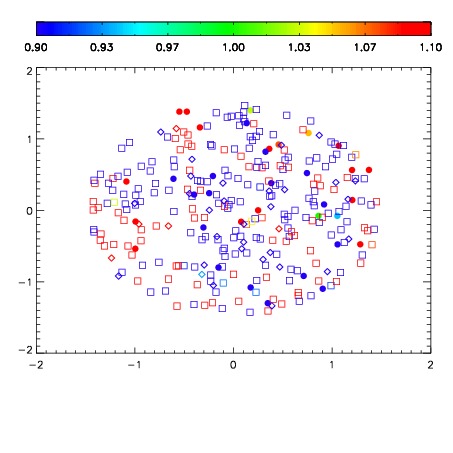
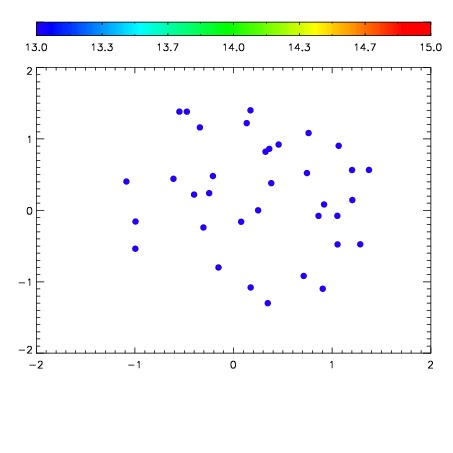

| Frame | Nreads | Zeropoints | Mag plots | Spatial mag deviation | Spatial sky 16325A emission deviations (filled: sky, open: star) | Spatial sky continuum emission | Spatial sky telluric CO2 absorption deviations (filled: H < 10) | |||||||||||||||||||||||
| 0 | 0 |
|
|
|
|
|
|
| IPAIR | NAME | SHIFT | NEWSHIFT | S/N | NAME | SHIFT | NEWSHIFT | S/N |
| 0 | 09080017 | 0.480072 | 0.00000 | 19.0987 | 09080018 | -0.000422845 | 0.480495 | 19.0962 |
| 1 | 09080016 | 0.479055 | 0.00101700 | 19.0084 | 09080015 | -0.000569831 | 0.480642 | 19.0615 |
| 2 | 09080013 | 0.479488 | 0.000584006 | 19.0018 | 09080014 | -0.000836642 | 0.480909 | 19.0356 |
| 3 | 09080012 | 0.479023 | 0.00104898 | 18.9368 | 09080011 | 0.00000 | 0.480072 | 18.8313 |